Despite enjoying record levels of subsidies and profits for large farms, and farm household income well above the U.S. average, some lawmakers want to increase farm subsidies for cotton, rice and peanut farmers.
Many farm groups and House and Senate Republicans feigned outrage over the recent Department of Agriculture announcement that farm income will drop from last year to this year. They cited the announcement to justify calls for increasing farm subsidy program payments in the upcoming farm bill. They say that because farm income is going down this year, farmers need more farm subsidies.
What they conveniently leave out is that farm income in 2023 will be the second highest in history, after only 2022.
Because of increased crop prices, farmers have fared well financially over the past few years and continue to prosper. Combined with the fact that most farm subsidies go to the largest and wealthiest farms, not the small farms that may need them, farmer success underscores why the farm bill shouldn’t increase subsidies.
Historically high income
Net farm income has been historically high in recent years.
Nationally, farm income in 2021 and 2022 topped historical averages and is expected to be above the average in 2023 too. Farm income is forecast to be $141.3 billion this year – 22.6 percent larger than the 20-year average of $115.2 billion.
It’s also expected to stay high for the foreseeable future. The Food and Agricultural Policy Research Institute recently predicted net farm income will hover around $140 billion a year through 2027, all above the 20-year average.
These numbers only include income made from farming. Total farm household income also includes other sources of income, and by that measure, farm households are faring especially well. Median farm household income is expected to increase this year, from $95,740 in 2022 to $98,148 in 2023.
Farm households have higher incomes and are considerably more wealthy than the average U.S. household. Farmers’ median household income has topped median U.S. household income every year since 1998. (See figure 1.) The disparity has been especially pronounced in the past 10 years.
Figure 1. Median farm household income is higher than median U.S. household income.
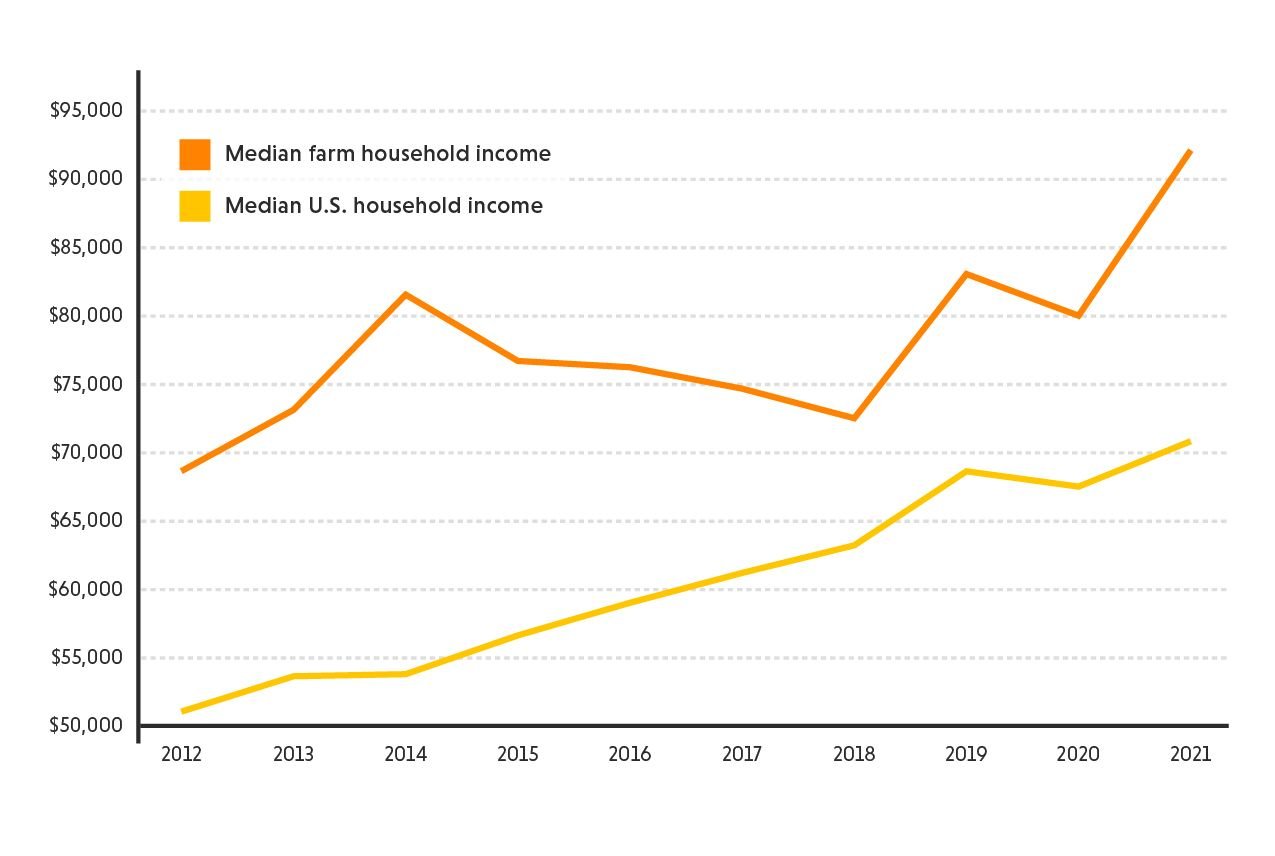
Source: EWG, from USDA Economic Research Service, Farm Household Income and Characteristics
Farm households, including even small farms, are wealthier than the average American household. In 2021, nearly all family farms – 97.6 percent – were wealthier than the average U.S. household.
Farm subsidy payments have also been high for many years. Total farm subsidies just under 10 years ago, in 2014 and 2015, were around $10 billion a year. But farm subsidies skyrocketed in the past five years, starting with the addition of the Trump-era Market Facilitation Program, in 2018. (See figure 2.)
Figure 2. Farm subsidies have been much higher than $10 billion a year in the past five years.
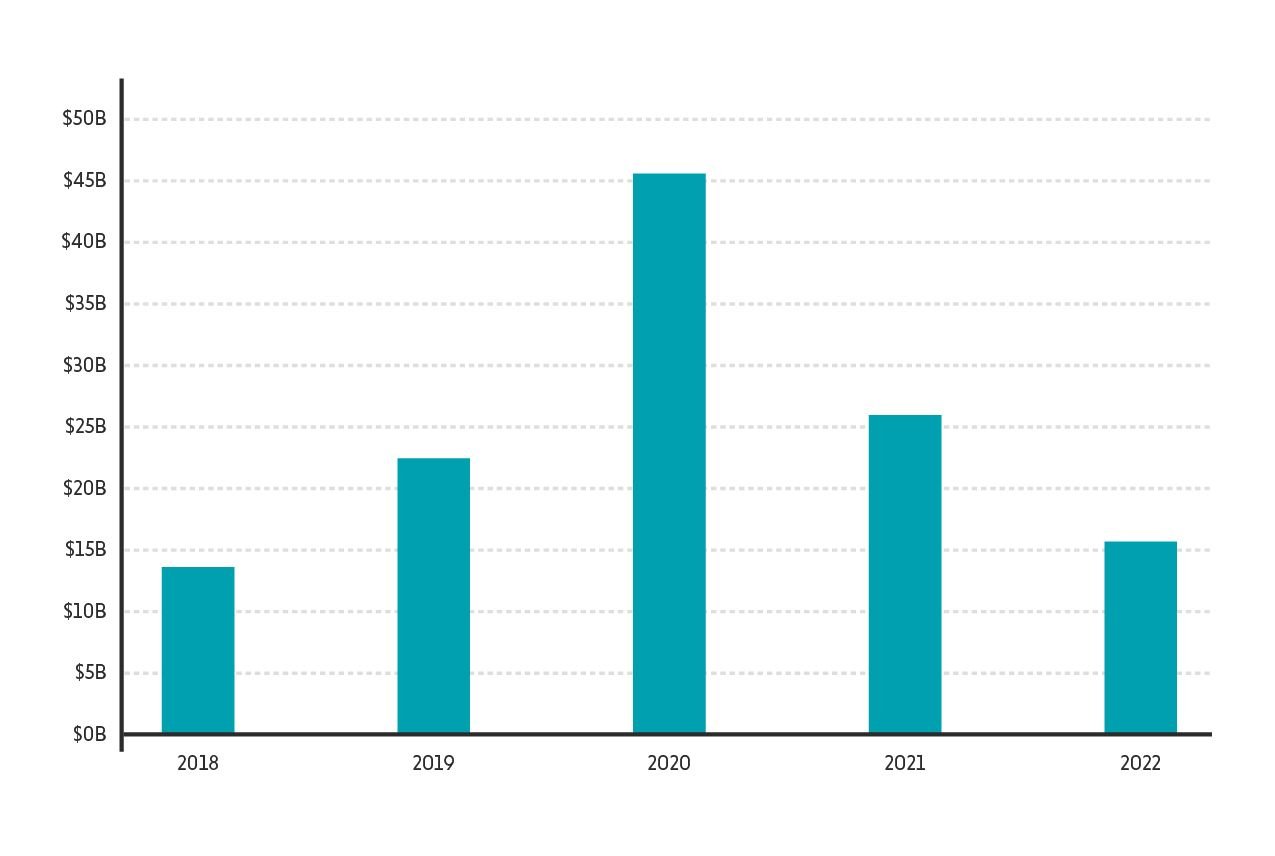
Source: EWG, from USDA Economic Research Service, Farm Income and Wealth Statistics
Taxpayers sent almost $123.2 billion to farmers between 2018 and 2022. Crop insurance premium subsidies brought in another $39.2 billion during those years, totaling $162.4 billion, or more than $30 billion a year.
Some members of Congress are seeking to pay out even more subsidies, especially to cotton, rice and peanut farmers, by increasing reference prices for covered commodities. Upping these subsidies would benefit fewer than 6,000 farmers, EWG has found, in a handful of Southern states. But record farm income and subsidies show why these farmers do not need to collect more payouts.