 Crop "Insurance" is a Misnomer
It’s a complete misnomer even to call the federal crop insurance program “insurance.” It works nothing like the private insurance market because taxpayers pay about 60 percent of the premiums, all the costs of administering the program and a large share of the claims payouts. Moreover, what crop insurance deems a “loss” bears little resemblance to any actual financial losses a farm family experiences. The cost to growers is so low that over time most can expect to collect far more in payouts than they pay in premiums. In other words, most farmers make money by just by buying a crop insurance policy.
Farmers Make Money On It
Between 2000 and 2014 farmers, in aggregate got back $2.20 in claims for each dollar they paid in premiums, an annual return of 120 percent. In aggregate, farmers enjoyed positive rates of return every year, ranging from 29 percent ($1.29 for every dollar of premium in 2007) to 324 percent ($4.24 for every dollar of premium in the 2012 drought year.)
A Gamble That's a Good Bet
Making more in payouts than growers pay in premiums is not a sure thing. Not all farmers enjoy a positive rate of return every year, and the rate of return varies dramatically across crops and regions. But the odds are in the growers’ favor, because premiums are so over-subsidized. It amounts to placing a bet in a casino where the size of the house’s money doubles your bet.
Back to Basics
Federal crop insurance can and should be a fiscally and environmentally responsible safety net that steps in when farmers suffer real financial losses that threaten the viability of their business. But that’s not what the program is today. Congress needs to step up and reform the program so that it works for taxpayers and the environment as well as it does for farmers.


Executive Summary
The federal crop insurance program – now the primary way taxpayers support farm income – is coming under increased and well-deserved scrutiny because of its high cost, lack of transparency and environmental implications.
Supporters of the program are passionate, arguing that the heavily subsidized insurance is an essential “safety net” – the only thing standing between farmers and financial ruin when bad weather slashes crop yields or market prices fall.
But a more sober analysis shows that it’s a complete misnomer even to call the program “insurance.” It works nothing like the private insurance market because the premiums that farmers pay cover just a small portion of the actual cost of the coverage.
Moreover, what crop insurance considers a “loss” that triggers a payout bears little resemblance to the actual financial losses a farm family has experienced. Hefty taxpayer subsidies pay about 60 percent of the premiums, all the costs of administering the program and a large share of the claims payouts.
The cost to growers is so low that over time most can expect to collect far more in payouts than they pay in premiums. In other words, most farmers make money by just by buying crop insurance.
That makes buying the “insurance” a lot like playing a very generous lottery. Making more in payouts than they pay in premiums is not a sure thing, but the odds are in the growers’ favor because premiums are so over-subsidized. It amounts to placing a bet in a casino where the size of your bet is doubled with the house’s money.
And, in fact, recent research confirms that farmers do indeed treat their crop insurance purchases more like buying into a subsidized lottery than buying risk management.
A good way to measure just how little federal crop insurance now resembles a safety net is to calculate the average annual rate of return that farmers receive on their premium dollars.
The average rate of return on crop insurance for all farmers in all states between 2000 and 2014 was 120 percent per year, meaning farmers received $2.20 back in claims for each dollar they paid in premium. In aggregate, farmers have enjoyed positive rates of return every year, ranging from 29 percent ($1.29 for every dollar of premium in 2007) to 324 percent ($4.24 for every dollar of premium) in the 2012 drought year.
Of course, not all farmers enjoy a positive return on crop insurance every year. The rate of return varies dramatically across crops and regions. Illinois soybean farmers averaged a 12 percent return from 2000 to 2014, whereas cotton farmers earned 235 percent in
Texas and 237 percent in Oklahoma. In general, rates of return are lowest in the Corn Belt and highest in states in the Great Plains and the Southeast.
Ending the Department of Agriculture’s so-called “direct payment” program was touted as a major accomplishment of the 2014 farm bill because money would now go to growers only when they suffered an actual “loss.” Despite the variability, however, the data show that at least some – and perhaps many – farmers actually make more money on crop insurance than they ever received in direct payments.
It's no surprise, then, that most farmers now participate in the program – an important goal that Congress wanted to achieve. But there is a way to achieve that goal while reducing the cost and distortions created by over-subsidized premiums: Decouple the size of the subsidies from farmers’ insurance-buying decisions.
Suppose, for example, that farmers received a fixed “risk-management” co-payment for each acre they farmed, without regard to what crop they planted or how much and what type of insurance they bought. In that scenario, farmers would more carefully consider how much insurance they actually needed, because more costly coverage would be paid out of their own bank accounts, rather than having 60 percent come from taxpayers.
Farmers would stay in the program to capture the fixed co-payment, so the Congressional objective of high participation would be met. Depending on the size of the fixed payment, the result could be a dramatic reduction in the program’s cost. With decoupled subsidies, farmers would buy less insurance, the amount of risk transferred to taxpayers would fall dramatically and the incentives to plant on environmentally sensitive land would diminish.
Federal crop insurance can and should be a fiscally and environmentally responsible safety net that steps in when farmers suffer financial losses that threaten the viability of their business. But that is not what the program is today.
Some will argue that the big regional differences in rates of return mean that farmers in low-risk areas pay too much compared to those in high-risk areas. But what that really means is that farmers everywhere pay too little and taxpayers pay too much – far too much in high-risk counties.
The crop insurance program doesn’t have to be a lottery where the odds favor growers at the expense of taxpayers. Congress needs to step up and reform the program so that it works for taxpayers and the environment as well as it does for farmers.
Introduction
The federal crop insurance program has become the primary way taxpayers support farm income. At the same time, the program is coming under increased and well-deserved scrutiny because of its high cost, lack of transparency and environmental implications.
Its supporters are passionate about the program, arguing that the heavily subsidized insurance is the only thing that stands between farmers and financial ruin when bad weather shrinks yields or market prices fall. In a letter to editor of the Kansas City Star, Steve Baccus, past president of the Kansas Farm Bureau, wrote[1]:
For farmers, a lifetime’s work and every penny they have can be wiped out by a single hail storm, a drought or a market crash that erases any chance of profit regardless of how well crops do. That is why the vast majority of Kansas farmers purchase crop insurance every year and why it must remain available, affordable and viable.
With the cost of farming so high, most farmers must show proof of crop insurance to secure production loans from banks. This allows banks to make production loans to folks who might otherwise be judged too risky.
One of those groups is young farmers. They are the key to the future of American agriculture. For them, if they haven’t purchased crop insurance, one bad year and they are done.
This, of course, is exactly the role that crop insurance should play – a safety net that protects farmers from financial losses that threaten the viability of their business.
However, the crop insurance program we have today has strayed far from what most people would consider a safety net. The taxpayer-funded subsidies to lower the cost of premiums have grown so large and the payouts so generous that the program now acts as yet another income support program for farmers, rather than as a risk management tool.
This paper documents just how far the program has moved from the original concept of an insurance plan designed to manage the risk of potentially crippling financial losses caused by circumstances beyond farmers’ control.
[1] http://www.kansascity.com/opinion/letters-to-the-editor/article4692579.html#storylink=cpy
Crop "Insurance" is a Misnomer
The commercial insurance industry is one of the largest sectors of the U.S. economy. In 2013 it directly employed about 2.3 million people and collected $1.1 trillion in premiums, approximately 7.7 percent of the national gross domestic product.[1] Insurance companies earn revenue from premiums and from the returns on the investments they maintain as a capital reserve. Their expenses include the cost of claims adjustments, the cost of marketing the policies, the cost of paying off claims and other overhead. When revenue exceeds these expenses, the company makes a profit. State insurance commissions regulate the industry to ensure that companies have the financial resources to pay off claims and that the policies are fairly written.
Because a portion of premiums is used to pay the non-claim expenses of operating an insurance company, customers do not expect to regularly get back more in claims than they pay in premiums. If they did, the company could not remain in business.
The Federal Crop Insurance Program, however, operates nothing like private commercial insurance. Instead, the government pays a large share of the farmers’ premiums and covers the expenses incurred by the companies to sell and service the policies. Moreover, what crop insurance considers a “loss” that triggers a payout bears little resemblance to the actual financial losses a farm family has experienced.
It is, in fact, a misnomer to apply the word “insurance” to the heavily subsidized program. The subsidies provided to the farmers and companies are so large and "losses" so frequntthat many growers can expect to receive much more in claims than they pay in premiums year after year.
Data on premiums versus claims show that the gains can be both frequent and large. The program operates more like a lottery than an insurance plan. For farmers, buying a subsidized federal crop insurance policy turns out to be a very good bet.
Farmers Make Money on Crop Insurance
There are two ways of measuring a farmer’s gains from purchasing a subsidized crop insurance policy:
- calculating the rate of return on the premium (the amount of net claim payouts expressed as a percent of the premium paid); and
- estimating net returns (the amount of claim payouts minus the premium paid).
When farmers get more back in payouts than they paid in premiums, both measures are positive. Conversely, if a farmer pays more in premium than he or she gets back in payouts, both the rate of return and net return are negative.
The rate of return when there has been no payout is negative 100 percent, and the net return equals the negative value of the premium paid. Similarly, a 100 percent rate of return means the farmer got a payout that was twice the size of the premium paid. The largest loss a farmer can experience from investing in a crop insurance policy comes when he or she gets no payout at all.
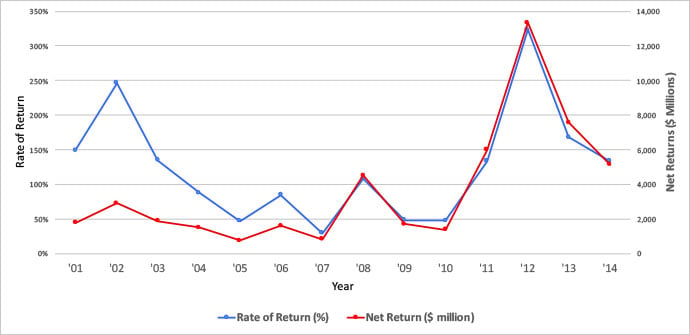
Figure 1 shows both rates of return and net returns for all insured farmers from 2001 to 2014. During this period, farmers in aggregate achieved a positive rate of return on their premium dollars every single year, which means that claims payouts exceeded premiums paid for 15 years in a row.
Figure 1. Aggregate Farmer Returns on Crop Insurance: 2001 – 2014
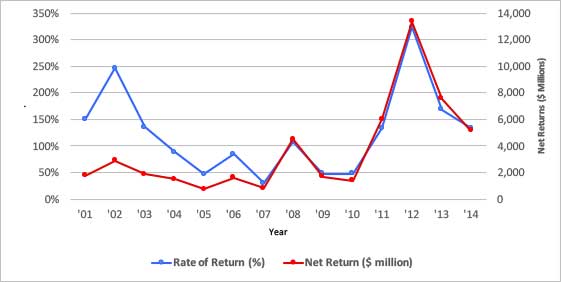
Source: Calculated from USDA-RMA Summary of Business Reports.
Growers’ aggregate rate of return from buying a crop insurance policies ranged from a “low” of 29 percent in 2007 to a high of 324 percent in 2012. That means that in 2007 farmers, in aggregate, got back what they paid in premiums plus 29 percent of that amount. The 324 percent rate of return for 2012 means that farmers got back more than four times what they paid in premiums.
The sharp growth in net returns since 2011 reflects both higher crop values as well as higher claims rates. From 2000 to 2014, the average rate of return from crop insurance was 120 percent per year. In contrast, even risky private-sector investments yield expected returns of around 15 to 25 percent. And as we all know, the return on the lowest-risk investments has been practically zero since 2009.
Farmers’ Gains Are Not Guaranteed
The data clearly demonstrate that in aggregate, crop insurance has been quite a good bet for U.S. farmers. But not every farmer in every state has enjoyed such favorable returns. Most do not receive a claim check every year. An individual farmer’s rate of return will be much more variable than shown in Figure 1, which also masks the large variability in the average rate of return between different crops and regions.
Figure 2 shows the annual rate of return on crop insurance for three state-crop combinations over the 26 years from 1989 to 2014.
Figure 2. Annual Rate of return on Crop Insurance for Three State/Crop Combinations
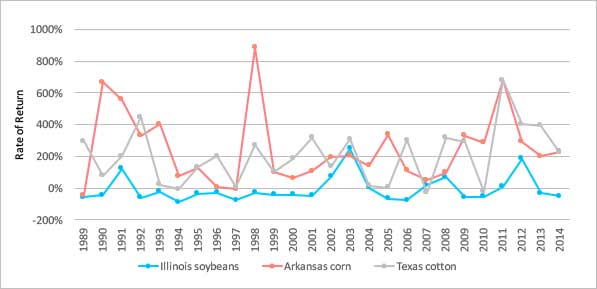
Source: Calculated from USDA-RMA Summary of Business Reports
At one extreme, Arkansas corn growers in aggregate enjoyed a 900 percent rate of return on crop insurance in 1998. And in 2011 Texas cotton farmers achieved almost a 700 percent return. In contrast, Illinois soybean farmers in aggregate experienced a negative return on crop insurance in 18 out of the 26 years shown. Their maximum return was just under 200 percent in 2012. The average annual rate of return on crop insurance over this period was minus 7 percent for Illinois soybean farmers, 247 percent for Arkansas corn farmers and 203 percent for Texas cotton farmers.
In three states – Arkansas, Florida and Mississippi – claims payouts exceeded premiums paid every year. In contrast, in four Corn Belt states – Minnesota, Iowa, Illinois and Indiana – claims payouts exceeded premiums in fewer than half the years.
When a "Loss" is not Really a Loss
In the federal crop insurance program, a farmer is considered to have suffered a loss whenever his or her per-acre revenue drops the level expected when the policy is signed. For example, if a farmer’s policy insures corn at $5.00 per bushel and the average corn yield is 200 bushels per acre, the expected revenue would be $1,000 per acre. Under crop insurance, the farmer is considered to have suffered a loss if his or her actual revenue turned out to be anything less than $1,000 per acre. If the farmer bought a policy with a coverage level at 80 percent coverage, it triggers an insurance payout as soon as farm revenue on that crop drops below $800 per acre -- even if $800 is enough to cover expenses and keep the farm profitable and financially secure.
In other words, the crop insurance definition of loss bears little relationship to the actual financial losses a farm family may suffer. In any other business, a loss occurs when revenue falls below what it cost to produce the goods it sells. In the case of a farm, that’s the crops and livestock. But federal crop insurance policies can produce payouts even when a farm is profitable.
For example, almost all farmers buy crop insurance policies that cover a single crop. A farm growing more than one crop, as most farms do, can have a profitable year even when income from one crop is less than production costs if the income from other crop(s) offsets the shortfall. But crop insurance will pay out on the one unprofitable crop even though the overall farming operation was profitable.
This distorted concept of loss results in more frequent payouts and increases the odds that the farmer will make a profit by buying a crop insurance policy.
[1] “Annual report on the insurance industry.” Federal Insurance Office of the US Treasury, June 2013.
Crop Insurance Lottery
The fact that most farmers have a good chance of making more in claims payouts than they paid in premiums clearly demonstrates how little the federal program resembles real insurance.
People who buy term life insurance won’t be around to collect on the policy, but they willingly pay their premium because of the value they place on knowing that their beneficiaries will be taken care of. Likewise people who buy health insurance willingly pay to guard against the risk that they may have health expenses that exceed their ability to pay.
Most family businesses do not have access to federally subsidized insurance, but some add business interruption coverage to their property insurance policy, at their own expense, to ensure that the business will survive a catastrophic event that would otherwise force them to close down.
None of these people or businesses count on getting back more in claims payouts than they paid in premiums. Indeed, “winning” that bet likely means something very bad happened to them.
The data in Table 1 provide a closer look at the outcomes the federal crop insurance program produces. These data demonstrate that for individual farmers, the odds of earning a positive rate of return on crop insurance are more uncertain than the aggregate data suggest. But the data also indicate that the odds of winning are clearly in the farmers’ favor, and that the winnings can be both large and frequent.
Odds of Winning Vary Between Regions and Crops
Table 1 presents average per-acre returns and average rates of return for various crop/state combinations in three regions. The top section includes important Corn Belt states and crops. The middle section shows some Great Plains states and crops. The bottom section presents Southern states and crops.
The data clearly show that farmers in different regions growing different crops have very different odds of achieving positive returns from crop insurance. Not one of the Corn Belt states has a rate of return greater than 100 percent. But in the Great Plains, only North Dakota soybeans have had a rate of return of less than 100 percent since 2000. Cotton in Oklahoma and Texas has rates of return greater than 200 percent. In the South, only North Carolina cotton and soybeans have rates of return of less than 100 percent, while Arkansas corn and wheat and North Carolina wheat have rates of returns greater than 200 percent.
Table 1. Rates of return vary between crops and states
| Rate of Return | Net Return ($/acre) | ||||
|---|---|---|---|---|---|
| 1989-1999 | 2000-2014 | 1989-1999 | 2000-2014 | ||
| Iowa | |||||
| Corn | 15% | 80% | 0.48 | 19.00 | |
| Soybeans | -5% | 43% | -0.37 | 4.72 | |
| Illinois | |||||
| Corn | -5% | 88% | -0.89 | 19.97 | |
| Soybeans | -33% | 12% | -1.58 | 1.26 | |
| Minnesota | |||||
| Corn | 53% | 60% | 8.51 | 13.5 | |
| Soybeans | 40% | 49% | 3.78 | 5.8 | |
| Wheat | 155% | 17% | 7.68 | -0.19 | |
| Kansas | |||||
| Wheat | 134% | 142% | 3.50 | 12.26 | |
| North Dakota | |||||
| Corn | 119% | 137% | 8.15 | 23.84 | |
| Soybeans | 54% | 83% | 2.35 | 9.45 | |
| Wheat | 76% | 111% | 3.73 | 10.70 | |
| Oklahoma | |||||
| Corn | 94% | 170% | 8.90 | 27.92 | |
| Cotton | 266% | 237% | 28.41 | 74.47 | |
| Wheat | 96% | 170% | 6.10 | 18.43 | |
| Texas | |||||
| Corn | 243% | 189% | 16.82 | 23.73 | |
| Cotton | 159% | 235% | 22.32 | 54.35 | |
| Soybeans | 115% | 185% | 9.26 | 22.54 | |
| Wheat | 163% | 241% | 7.33 | 24.06 | |
| Arkansas | |||||
| Corn | 282% | 221% | 24.27 | 34.59 | |
| Cotton | 179% | 120% | 31.77 | 20.02 | |
| Soybeans | 95% | 96% | 7.23 | 7.84 | |
| Wheat | 223% | 220% | 13.62 | 20.78 | |
| Georgia | |||||
| Corn | 95% | 132% | 8.94 | 20.25 | |
| Cotton | 74% | 116% | 14.70 | 26.37 | |
| Soybeans | 78% | 105% | 6.60 | 12.04 | |
| Wheat | 47% | 159% | 2.38 | 14.62 | |
| North Carolina | |||||
| Corn | 72% | 112% | 6.78 | 19.33 | |
| Cotton | 78% | 91% | 11.29 | 13.94 | |
| Soybeans | 47% | 87% | 4.44 | 9.09 | |
| Wheat | 37% | 203% | 1.98 | 12.13 | |
There are also regional differences in average per-acre returns. Since 2000, the highest average net return was $74.47 per acre for Oklahoma cotton, with Texas cotton the next highest at $54.35 per acre. Minnesota wheat has experienced a negative average per-acre return, and the Illinois soybean average of $1.26 per acre is close to zero. The Iowa and Minnesota average net returns are also quite low compared to net returns in other states and regions.
Various explanations have been given for these regional variations. Some argue that USDA has set premiums too low in the Corn Belt and too high elsewhere.[1] An alternative explanation is that Corn Belt weather has been abnormally benign in recent years, leading to lower-than expected claims payouts.
Odds Are In Farmers’ Favor
The data in Table 1 clearly show that the odds of winning the bet on a crop insurance policy vary among crops and regions. But the data also show that the odds of winning are quite good nearly everywhere. From 2000 to 2014, the rate of return was positive for all crop/state combinations and net returns were positive for all but Minnesota wheat.
The odds of a farmer collecting more in claims payouts than he or she paid in premiums are in the farmer’s favor because the size of the bet — the premium paid — is less than the average payoff. This results from taxpayers paying more than half of the premium. It is as if half of a gambler’s bet came from the casino’s money. The effect of premium subsidies on rates of return and net returns is clearly evident in Table 1.
Passage of the Agricultural Risk Protection Act (ARPA) in 2000 greatly increased the premium subsidies, doubling the share of premiums paid by the government for most policies and coverage levels. In Table 1, returns on crop insurance are calculated for two periods: 1989 to 1999 (before ARPA) and from 2000 to 2014 (after ARPA).
For nearly all state and crop combinations, both the average rate of return and the average per-acre net returns were much higher in the post-ARPA period than earlier. This reflects both the higher premium subsidies available under ARPA and higher commodity prices since 2006.
Insurance Returns versus Direct Payments
The uncertainty of gaining a positive net payout makes the payoffs from crop insurance more like a lottery with favorable odds than the sure thing that farmers enjoyed through the discredited direct payment program. Ending direct payments was touted as a major accomplishment of the 2014 farm bill. Payments would now go to growers only when they had suffered an actual “loss.”
Despite the variability, however, the data show that at least some – and perhaps many – farmers will achieve similar or better net returns from crop insurance than they got in direct payments.
Before direct payments were reduced for some farmers in 2009, the average direct payment per planted acre was about $27 for corn, $8 for soybeans, $20 for wheat and $40 for cotton. Table 1 shows that crop insurance net returns per acre for corn ranged from $13.50 in Minnesota to $34.59 in Arkansas. Net returns for soybeans ranged from $1.26 in Illinois to $22.54 in Texas; for wheat from minus $0.19 in Minnesota to $24.06 in Texas, and for cotton from $13.94 in North Carolina to $74.47 in Oklahoma.
Between 2001 and 2015 crop insurance total net returns averaged about $3.6 billion a year; less than the $5 billion sent out annually in direct payments. For every year since 2011, however, total net returns exceeded the value of total direct payments, ranging from just over $5 billion in 2014 to over $13 billion in 2012.
Lottery versus Risk Management
The result of purchasing a subsidized crop insurance policy looks more like a lottery than a safety net designed to step in when farmers suffer a serious financial loss. Studies of the choices farmers make when deciding which crop insurance policy to buy also suggest that risk management is not the deciding factor.
Researchers at Iowa State University and the University of Wisconsin have shown that if farmers had to rely solely on crop insurance to manage their risk, and if risk management was the sole motivation for buying the insurance, nearly all farmers would buy at least 80 percent coverage in light of the high rate at which premiums are subsidized.[2] Many would buy 85 percent coverage. If premiums were not subsidized, farmers would buy the maximum amount of coverage available to them.
However, in most regions of the country farmers buy much less than the maximum available level of coverage. In 2014, the average coverage levels for the top four insured crops were 75 percent for corn, 74 percent for soybeans, 70 percent for wheat and 66 percent for cotton. This discrepancy means that either the standard model economists use to explain risk management decisions is wrong, or farmers have ways to manage risk that are more cost-effective than crop insurance.
In a recent study, I applied the framework developed by Daniel Kahneman and Amos Tversky to crop insurance to see if its predictions on how much coverage farmers would buy lined up well with what they actually did – rather than what economists said they should do.[3]
Kahneman and Tversky, both psychologists, waded into the realm of mathematical economics in the mid-1970s with a new way of explaining how people make decisions that involve uncertain outcomes. Their chief insight was that in decisions involving risk, people place a higher value on avoiding losses than they do on getting the same amount of gains. For example, most people would choose not to play a gamble where there is a 50 percent chance of winning $1,050 and a 50 percent change of losing $1,000, even though the gain from a win is larger than the potential loss. Kahneman and Tversky call people’s reluctance to take gambles of this sort “loss aversion.”
Another key aspect of Kahneman and Tversky’s framework for explaining how people choose between risky ventures (called prospect theory) is selecting the so-called financial “reference point.” An outcome from a risky prospect that is greater than the reference point is viewed as a “gain,” whereas one that is less than the reference point is viewed as a “loss.” I set one reference point so that the model would predict coverage choices made by farmers if they used crop insurance as a risk management tool. I set a second reference point so that the model would predict farmers’ choices if they treated crop insurance more like a lottery than a risk management tool.[4]
My study carefully modeled the coverage choices of a representative corn farmer in York County, Neb., a cotton famer in Lubbock County, Texas and a wheat farmer in Sumner County, Kansas. In all three cases, modeling crop insurance as a lottery rather than as a risk management tool predicted coverage level choices that were more consistent with the levels actually chosen by farmers in these counties.
[1] See, for example, Woodard, J.D., B.J. Sherrick, and G.D. Schnitkey. “Actuarial Impacts of Loss Cost Ratio Ratemaking in U.S. Crop Insurance Programs.” Journal of Agricultural and Resource Economics, 36(1):211-228.
[2] Du, X., H. Feng, and D.A. Hennessy. “Rationality of Choices in Subsidized Crop Insurance Markets.” Working Paper 14-WP 545, Center for Agricultural and Rural Development, Iowa State University, February, 2014.
[3] Babcock, B.A. 2015. “Using Cumulative Prospect Theory to Explain Anomalous Crop Insurance Coverage Choice.” American Journal of Agricultural Economics doi:10.1093/ajae/aav032.
[4] For example see Collins, K., and T. Zacharias. “A 25 Year Milestone in Farm Policy: A Look Back at the 1989 GAO Report.” CropInsurance Today. February 2014 vol 47 No. 1. Available at https://www.ag-risk.org/NCISPUBS/Today/2014/Feb_2014_Today.pdf
Policy Implications
It is no accident that federal crop insurance works like a lottery. The Federal Crop Insurance Act that Congress passed and repeatedly amended creates the very conditions that lead farmers to view crop insurance more like a lottery than a risk management tool.
Federal Crop Insurance Act
The reason a farmer can expect a positive rate of return from a crop insurance policy is because the government picks up a large share of the cost of the premium. The Federal Crop Insurance Act specifies how much of the premium the government will pay. The subsidy rate varies with the coverage level a farmer chooses. In general, the premium subsidy percentage decreases as coverage levels increase (Table 2).
Table 2: Share of Premiums Paid by the Government
|
Policy Coverage Level |
50% |
55% |
60% |
65% |
70% |
75% |
80% |
85% |
|
Share of Premium Paid by Government |
67% |
64% |
64% |
59% |
59% |
55% |
48% |
38% |
USDA’s Risk Management Agency (RMA) establishes the premium for a policy at an amount that, over time, should cover all the payouts from that policy. Farmers, however, pay less than that amount of premium, thanks to the subsidies. This is why farmers can expect to make money buying crop insurance policies; they are paying less than the amount of payouts RMA expects to make on that policy.
The percent of the policy premium paid by taxpayers essentially determines the “target” rate of return – the rate of return a farmer can expect to enjoy by buying the policy. For example, if the true premium for a policy is $100 but the farmer only pays $50, then over time, that farmer can expect to get $100 in payouts, a target rate of return of 100 percent. A subsidy rate of 50 percent, in other words, implies a target rate of return of 100 percent.[1]
The target rate of return declines as the coverage level increases and the share of the premium paid by the government decreases. The target rate of return on a policy for which taxpayers pay 67 percent of the premium is 203 percent. That target rate of return declines to 61 percent if taxpayers are picking up 38 percent of the cost of the premium (Figure 3).
Since 2000, most farmers have chosen policies with coverage levels between 65 percent and 75 percent, which are subsidized at 59 and 55 percent respectively. This means the crop insurance program overall is targeted at providing an average rate of return on the farmer-paid premiums of 120-to-140 percent.[2] It is apparent from Table 1 that outside the Corn Belt the average rate of return since passage of ARPA has been higher than this target, but inside the Corn Belt it has been lower. The overall average rate of return from 2000 to 2014, calculated using the data in Figure 1, has been 124 percent, which is not too far off from the target. This suggests that Corn Belt premiums have been set at relatively higher levels relative to payouts than in non-Corn Belt areas.
Figure 3: Target Rates of Return for Crop Insurance
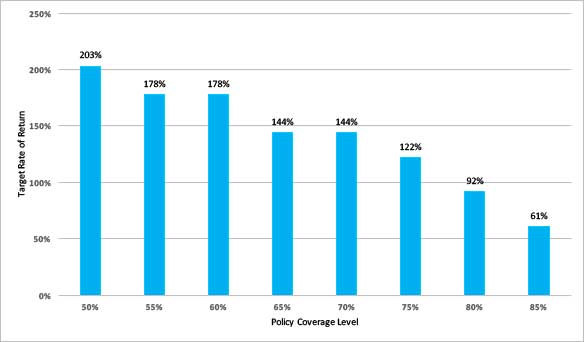
Source: Calculated from the premium subsidy levels in Table 3
Clearly, ensuring that farmers have a good chance of getting back more in claims than they pay in premiums is baked into the design of the federal crop insurance program.
[1] The target rate of return assumes that unsubsidized premium is exactly equal the average insurance payment received. Thus if the subsidy is zero, the target rate of return is 0%.
[2] In recent years enterprise unit coverage has become more popular with farmers, particularly in the Corn Belt. Under enterprise coverage all land planted to a single crop in a county is insured together, rather than each farm being insured separately. Premiums for enterprise units are more heavily subsidized with subsidies ranging from 53% at a coverage level of 85% to 80% for coverage levels of 70% or lower. These subsidy levels correspond to target rates of return of 113% to 800%.
Moving From Lottery To Risk Management
Designing crop insurance to produce high rates of return to farmers based on the premiums they pay dramatically increases the cost of the program and encourages farmers to choose policies as if they’re playing a lottery rather than actually managing risk. Many studies have shown that farmers buy crop insurance only because it is heavily subsidized. If the subsidies were reduced, many farmers would find more cost effective ways of managing risk. They would purchase far lower amounts of insurance, which would transfer much less risk to the government. The unintended but serious problems caused by excessive risk transfers to the taxpayers would be avoided.
The excessive risk transfer creates incentives to plant on marginal and environmentally sensitive lands that would otherwise be too risky to farm. It also puts upward pressure on land rents, because the claims payouts make it easier for growers to afford higher rents.
Supporters of the status quo argue that the high rates of return are needed to bring a large proportion of farmers into the program and avoid the problem of adverse selection – when only farmers with a high likelihood of making a claim would buy insurance. It also makes it easier for Congress to avoid the trouble and uncertainty of funding ad hoc disaster aid for agriculture.
However, an alternative policy design that decouples premium subsidies from coverage decisions would avoid both adverse selection and ad hoc disaster payments while encouraging farmers to buy only the levels of insurance that meet their risk management needs. A decoupled subsidy would mean that farmers could not alter the size of the subsidy by strategically choosing policies with different coverage levels and different subsidy rates.
Decoupling farm program payments from production decisions in the 1996 farm bill dramatically reduced the incentive for farmers to plant for the program rather than the market. The result was an expansion in soybean acreage and drops in cotton, wheat and rice acreage. Farmers received fixed subsidies but planted for the market.
Decoupled premium subsidies would work much the same way. Farmers would stay in the crop insurance program in order to receive a subsidy, but they would make their insurance decisions based on risk management needs rather than on a subsidized lottery. Just as farmers try to apply fertilizer just to the point where the cost of applying another pound equals the return they get from that extra pound, farmers would buy insurance until the last dollar they spend on it just equaled the risk management benefit they receive. Most farmers would respond by lowering their coverage levels and buying more whole-farm insurance that would only pay off if the revenue from all their crops fell below a critical level.
Decoupling premium subsidies could be accomplished in several ways. For example, a fixed per-acre premium subsidy could be made available to all farmers for all their crop acres. They would receive the subsidies as a fixed amount of credit that would be applied toward their crop insurance premium. Or subsidies could be set at the value, in dollars per acre, equivalent to the subsidy a farmer receives when he or she buys a policy at a 65 percent coverage.
A fixed per-acre premium subsidy would be equitable across crops and regions. Setting the premium subsidy at the rate that a 65 percent policy is subsidized would provide more per-acre support to crops with high prices and regions with high risk. Either option would move farmers toward using crop insurance as a risk management tool, rather than as a subsidized lottery ticket. The critical feature is that no farmer could influence the size of the subsidy by changing how much insurance to buy.
Decoupling premium subsidies would also save taxpayers billions of dollars a year. The subsidies averaged about $26 per crop acre in 2014. Fixing the premium subsidy at $13 per acre – half that amount – would save almost $3 billion a year. Because subsidies paid to crop insurance companies and agents increase with the level of insurance farmers buy, shifting to lower coverage levels would also reduce the cost of running the program. The subsidies paid to crop insurance companies and agents have averaged about $2 billion a year over the last 10 years. If farmers reduced their premium costs by 50 percent, decoupling premium subsidies would save another $1 billion a year.