
Nitrate in drinking water at levels greater than the Federal standard of 10 parts per million (ppm) can cause methemoglobinemia, a potentially fatal condition in infants commonly known as blue-baby syndrome. According to Dr. Burton Kross, of the University of Iowa's Center For International Rural and Environmental Health, nitrate poisoning via drinking water contamination "certainly contributes to national infant death rate statistics" (Johnson and Kross 1990). Agriculture is the primary source of nitrate contamination.
An Environmental Working Group review of nearly 200,000 water sampling records found that over two million people -- including approximately 15,000 infants under the age of four months -- drank water from 2,016 water systems that were reported to EPA for violating the nitrate standard at least once between 1986 and 1995 (Table 1). All of these water systems were termed "significant non-compliers" by EPA and 60% were repeat violators. The ten largest water systems that violated the federal nitrate standard between 1986 and1995 were Columbus, OH; Scottsdale and Chandler, AZ; Decatur, IL; Upland, CA; Bloomington, IL; Peoria, AZ; Manteca, CA; Rialto, CA; and Gilbert AZ.
Table 1: 2.1 million people drank water from systems that violated federal nitrate standards at least once since 1985
| State | Number of Systems in Violation |
Population Affected |
|---|---|---|
| Ohio | 36 | 413,441 |
| Arizona | 42 | 400,765 |
| California | 112 | 380,670 |
| Illinois | 156 | 274,332 |
| Pennsylvania | 456 | 154,877 |
| Kansas | 103 | 86,130 |
| Washington | 39 | 67,325 |
| Oklahoma | 132 | 66,938 |
| Iowa | 137 | 52,970 |
| Nebraska | 116 | 44,513 |
| Texas | 60 | 41,685 |
| Colorado | 22 | 39,707 |
| Connecticut | 8 | 21,142 |
| Delaware | 85 | 19,142 |
| Michigan | 74 | 18,435 |
| Maryland | 59 | 15,983 |
| New Jersey | 59 | 10,511 |
| New York | 16 | 10,323 |
| Wisconsin | 63 | 6,015 |
| Florida | 36 | 4,964 |
| Minnesota | 44 | 4,440 |
| Indiana | 35 | 3,798 |
| Kentucky | 5 | 3,428 |
| North Carolina | 19 | 2,720 |
| South Dakota | 13 | 2,619 |
| West Virginia | 6 | 2,303 |
| New Mexico | 12 | 1,938 |
| Virginia | 10 | 1,889 |
| Oregon | 8 | 1,820 |
| Vermont | 2 | 1,680 |
| Idaho | 4 | 1,530 |
| Rhode Island | 8 | 1,240 |
| Montana | 8 | 963 |
| Alaska | 7 | 850 |
| Missouri | 4 | 634 |
| South Carolina | 10 | 395 |
| Maine | 5 | 365 |
| Georgia | 1 | 200 |
| North Dakota | 3 | 155 |
| Massachusetts | 1 | 25 |
| Total | 2,016 | 2,162,860 |
Water utilities in Decatur, Bloomington, Streator, and Pontiac, Illinois all violated the nitrate standard in eight years out of the ten. Danville, Illinois was close behind with seven violations during the same time period. Columbus, Ohio violated the standard five years in a row from 1985 through 1989, at which time they were granted a special "waiver" from subsequent violations. Under this deal with the state, the utility can serve water that exceeds that standard without being cited for violating the standard as long as the community is warned about it (Evans 1995).
An additional 3.8 million people drink water from private wells that are contaminated above the 10 ppm nitrate standard. In seven states -- California, Pennsylvania, New York, Illinois, Wisconsin, Minnesota, and Iowa -- more than 100,000 people are exposed to nitrate above the federal standard via private drinking water wells (Table 2).
Table 2: In ten states, more than 10% of all drinking water wells are contaminated with nitrate above federal health standards
| State | Population Above EPA Standards |
% Contamination Above EPA Standards |
|---|---|---|
| Delaware | 48,311 | 35.0% |
| Kansas | 69,944 | 28.0% |
| Iowa | 124,771 | 18.3% |
| California | 428,301 | 15.0% |
| New York | 239,685 | 15.0% |
| Nebraska | 52,870 | 14.0% |
| Arizona | 37,612 | 14.0% |
| Illinois | 164,510 | 12.0% |
| Colorado | 29,800 | 12.0% |
| Wisconsin | 148,582 | 10.0% |
| Texas | 80,404 | 9.4% |
| Minnesota | 134,365 | 9.3% |
| Pennsylvania | 245,241 | 9.0% |
| Connecticut | 55,412 | 9.0% |
| Maryland | 67,437 | 8.0% |
| Maine | 43,100 | 8.0% |
| New Jersey | 61,936 | 6.8% |
| South Dakota | 9,428 | 6.7% |
| Virginia | 96,205 | 6.4% |
| Wyoming | 6,899 | 6.4% |
| Missouri | 51,330 | 5.0% |
| Oregon | 27,477 | 5.0% |
| North Dakota | 7,170 | 4.6% |
| Indiana | 69,900 | 4.5% |
| Kentucky | 42,289 | 4.2% |
| Idaho | 9,536 | 4.0% |
| Nevada | 3,215 | 4.0% |
| Arkansas | 22,341 | 3.9% |
| Ohio | 66,474 | 3.8% |
| Montana | 7,342 | 3.8% |
| North Carolina | 59,926 | 3.2% |
| Alaska | 4,763 | 3.2% |
| New Mexico | 6,165 | 2.0% |
| Utah | 1,140 | 2.0% |
| Washington | 13,533 | 1.5% |
| New Hampshire | 5,809 | 1.4% |
| Vermont | 3,213 | 1.4% |
| Michigan | 20,234 | 1.2% |
| Oklahoma | 5,762 | 1.2% |
| Florida | 17,099 | 1.0% |
| Georgia | 13,141 | 1.0% |
| Massachusetts | 5,118 | 1.0% |
| Tennessee | 8,175 | 0.9% |
| West Virginia | 5,396 | 0.9% |
| Louisiana | 4,855 | 0.8% |
| South Carolina | 9,579 | 0.7% |
| Mississippi | 1,316 | 0.2% |
Over twelve million people in the United States drink water from nearly 1,000 water systems where some or all of the drinking water supply is contaminated by nitrate at levels above the EPA's 10 ppm standard (Table 3); 8.7 million of these people are in California (Table 4). While the majority of these systems are still able to provide drinking water that meets the 10 ppm standard, often this comes at significant cost to water utilities and ratepayers.
Table 3: Drinking water supplies for many U.S. cities are contaminated with nitrate above the federal health standard
| Rank | System | City | State | Population Served | Date of most recent sample over federal nitrate standard |
Percent of samples over federal nitrate standard. |
Number of Samples Taken | Maximum Test Result |
|---|---|---|---|---|---|---|---|---|
| 1 | Phoenix Munic. Water System | Phoenix | AZ | 1,000,000 | 10/26/94 | 7.3% | 82 | 17.4 |
| 2 | El Paso Water Utilities | El Paso | TX | 620,000 | 5/26/93 | 2.0% | 49 | 13.47 |
| 3 | Mesa, Munic. Water Dept. | Mesa | AZ | 302,000 | 8/10/94 | 2.4% | 41 | 11 |
| 4 | Scottsdale | Scottsdale | AZ | 174,170 | 10/20/94 | 1.0% | 105 | 10 |
| 5 | Glendale Munic. Water CC | Glendale | AZ | 150,000 | 3/1/95 | 10.5% | 57 | 16 |
| 6 | Chandler, Munic. Wtr Dept. | Chandler | AZ | 120,000 | 10/12/94 | 5.0% | 60 | 13.9 |
| 7 | Janesville Water Utility | Janesville | WI | 52,133 | 12/5/94 | 100.0% | 1 | 11 |
| 8 | Peoria, City Of | Peoria | AZ | 50,618 | 10/6/94 | 13.3% | 15 | 12.6 |
| 9 | State College Boro. Water Auth. | State College | PA | 47,000 | 2/18/93 | 3.2% | 31 | 10.4 |
| 10 | Newark, City Of | Newark | OH | 46,000 | 11/10/94 | 2.8% | 36 | 41 |
| 11 | Gilbert, Town Of | Gilbert | AZ | 45,000 | 6/24/94 | 7.1% | 14 | 19.4 |
| 12 | Utility Parkway | Cedar Falls | IA | 34,298 | 4/10/95 | 1.4% | 71 | 10.6 |
| 13 | Richland, City Of | Richland | WA | 32,600 | 6/27/95 | 19.3% | 942 | 19 |
| 14 | Friendswood, City Of | Friendswood | TX | 27,108 | 6/12/95 | 5.0% | 20 | 30.07 |
| 15 | AZ Water Co., Casa Grande | Casa Grande | AZ | 26,121 | 1/11/94 | 8.3% | 24 | 12.1 |
| 16 | Pasco Water Department | Pasco | WA | 25,465 | 8/30/94 | 33.3% | 36 | 17.4 |
| 17 | Citizens Util., Mohave | Bullhead City | AZ | 25,000 | 6/13/95 | 31.3% | 16 | 15 |
| 18 | SACWSD - Shallow Well #18 | Commerce City | CO | 22,400 | 6/7/95 | 8.5% | 59 | 12.3 |
| 19 | Avondale, City Public Works | Avondale | AZ | 22,000 | 6/16/93 | 22.2% | 9 | 14 |
| 20 | Kearney, City Of | Kearney | NE | 21,751 | 7/14/93 | 25.0% | 8 | 16.4 |
| 21 | Dodge City, City Of | Dodge City | KS | 21,294 | 2/8/95 | 17.8% | 45 | 16.2 |
| 22 | Bonney Lake Water Department | Bonney Lake | WA | 18,586 | 5/10/94 | 14.3% | 14 | 27 |
| 23 | Great Bend PWS/Central KS Utils | Great Bend | KS | 15,427 | 3/1/95 | 7.1% | 28 | 10.41 |
| 24 | Spanaway Water Company | Spanaway | WA | 14,613 | 9/22/94 | 7.7% | 26 | 27 |
| 25 | Brighton, City Of | Brighton | CO | 14,500 | 5/25/93 | 15.4% | 26 | 18.5 |
| 26 | Ephrata Joint Authority | Ephrata | PA | 14,300 | 7/14/93 | 2.9% | 35 | 11 |
| 27 | Shippensburg Boro. Water | Shippensburg | PA | 13,500 | 5/20/94 | 5.3% | 19 | 10.2 |
| 28 | Horsham Water Authority | Horsham | PA | 13,304 | 1/26/93 | 2.3% | 44 | 101.7 |
| 29 | Beatrice, City Of | Beatrice | NE | 12,891 | 7/14/94 | 36.4% | 22 | 252.9 |
| 30 | Sterling, City Of | Sterling | CO | 12,500 | 7/11/94 | 23.5% | 34 | 13.1 |
Table 4: Drinking water supplies for many California cities are contaminated with nitrate above the federal health standard
| Rank | System | City | Population Served | Date of most recent sample over federal nitrate standard | Percent of samples over federal nitrate standard | Number of Samples Taken | Maximum Test Result |
|---|---|---|---|---|---|---|---|
| 1 | Los Angeles | Los Angeles | 3,600,000 | 6/15/95 | 1.1% | 190 | 12.5 |
| 2 | City Of Santa Ana | Santa Ana | 293,700 | 11/22/95 | 24.0% | 146 | 12.9 |
| 3 | Eastern MWD | San Jacinto | 253,705 | 5/9/95 | 3.7% | 54 | 12.2 |
| 4 | City Of Riverside | Riverside | 245,000 | 11/30/95 | 6.6% | 457 | 35.6 |
| 5 | Glendale-City, Water Dept. | Glendale | 184,000 | 11/7/95 | 5.4% | 331 | 11.9 |
| 6 | California Water Service | Bakersfield | 182,670 | 7/13/95 | 3.6% | 357 | 13.1 |
| 7 | City Of Modesto | Modesto | 180,320 | 10/7/94 | 7.7% | 260 | 13.9 |
| 8 | City Of Pasadena | Pasadena | 153,217 | 6/23/93 | 8.3% | 24 | 12.8 |
| 9 | San Gabriel Valley Water Co. | El Monte | 150,105 | 3/13/95 | 3.2% | 317 | 12.3 |
| 10 | City Of Garden Grove | Garden Grove | 148,000 | 1/12/93 | 1.3% | 77 | 14.5 |
| 11 | City Of Ontario | Ontario | 143,285 | 1/25/94 | 1.1% | 179 | 10.2 |
| 12 | Pomona- City, Water Dept. | Pomona | 136,525 | 12/4/95 | 38.0% | 739 | 22.5 |
| 13 | Cucamonga CWD | Rancho Cucamonga | 128,000 | 11/22/95 | 11.3% | 160 | 15.5 |
| 14 | Desert Water Agency | Palm Springs | 125,000 | 1/27/93 | 1.6% | 61 | 11.8 |
| 15 | City Of Corona | Corona | 104,000 | 8/9/95 | 50.0% | 44 | 26.7 |
| 16 | San Gabriel Valley WC | Fontana | 102,599 | 11/7/95 | 9.2% | 295 | 18.3 |
| 17 | California Water Service | Salinas | 100,300 | 9/8/94 | 5.3% | 114 | 13.3 |
| 18 | Suburban Water Systems | San Jose | 93,758 | 11/15/95 | 17.9% | 563 | 30.9 |
| 19 | Daly City MWU | Daly City | 92,311 | 10/19/95 | 50.0% | 18 | 15.1 |
| 20 | City Of Alhambra | Alhambra | 86,300 | 6/8/94 | 5.7% | 35 | 12.7 |
| 21 | California Water Service | Visalia | 82,300 | 4/8/93 | 0.5% | 182 | 10.0 |
| 22 | Cal-Water Service Co. | Chico | 73,220 | 12/15/94 | 2.3% | 177 | 13.6 |
| 23 | Palmdale WD | Palmdale | 70,000 | 2/2/95 | 4.9% | 41 | 12.3 |
| 24 | Redlands City MUD | Redlands | 69,300 | 5/16/95 | 4.0% | 430 | 36.0 |
| 25 | City Of Upland | Upland | 66,383 | 5/31/94 | 1.7% | 59 | 17.5 |
| 26 | Casitas Municipal WD | Oakview | 60,000 | 2/21/95 | 50.0% | 2 | 12.0 |
| 27 | California Water Service | South San Francisco | 56,200 | 12/29/94 | 40.0% | 25 | 18.4 |
| 28 | East Valley WD | San Bernardino | 55,000 | 10/12/95 | 6.3% | 573 | 16.7 |
| 29 | Calif Water Service | Los Altos | 53,740 | 3/21/94 | 1.3% | 80 | 10.0 |
| 30 | City Of Chino | Chino | 52,130 | 10/26/95 | 35.3% | 85 | 19.2 |
Unlike virtually all other contaminant standards, the 10 ppm federal drinking water standard for nitrate contains no safety factor. This means that several days' worth of infant formula mixed with water contaminated with nitrate at levels over 10 ppm can easily cause methemoglobinemia in infants under four months of age. Repeated consumption of this water over a period of days or weeks can cause severe blue baby syndrome, and even death.
320 "water systems to watch" serving 2.8 million people in the 21 states have had at least one nitrate sample between nine and ten parts per million. Infants are at significant risk in these communities because prolonged exposure to nitrate at levels extremely close to the 10 ppm standard typically occurs with no efforts to warn the population or reduce nitrate levels in drinking water (Table 5).
Table 5: Cities with "Water to Watch." 33 large water systems reported at least one tap water or well water sample contaminated
| Rank | System | City | State | Population Served | Highest Sample | Date of Highest Sample | Number of Samples Taken | % Over Int'l Standard |
|---|---|---|---|---|---|---|---|---|
| 1 | Waterloo Water Works | Waterloo | IA | 66,467 | 9.9 | 8/10/94 | 113 | 25.7% |
| 2 | East Hempfield Water Authority | Landisville | PA | 13,493 | 9.9 | 9/15/93 | 73 | 58.9% |
| 3 | Harford County Dpw | Bel Air | MD | 63,000 | 9.9 | 7/26/93 | 20 | 10.0% |
| 4 | Westminster | Westminster | MD | 22,766 | 9.9 | 2/18/93 | 18 | 77.8% |
| 5 | City Of Wasco | Wasco | CA | 13,774 | 9.8 | 2/14/95 | 7 | 42.9% |
| 6 | Northern Il Wtr Corp-Pontiac | Pontiac | IL | 11,200 | 9.8 | 3/26/95 | 63 | 50.8% |
| 7 | City Of Lancaster Authority | Lancaster | PA | 108,000 | 9.8 | 2/8/94 | 18 | 38.9% |
| 8 | Cal. Water Service Co. - East L.A. | San Jose | CA | 152,970 | 9.8 | 7/13/93 | 21 | 23.8% |
| 9 | Morro Bay City Water Dept | Morro Bay | CA | 15,000 | 9.8 | 7/5/95 | 25 | 28.0% |
| 10 | City Of Manteca | Manteca | CA | 44,500 | 9.8 | 3/5/93 | 24 | 41.7% |
| 11 | City Of Chino Hills | Chino Hills | CA | 49,000 | 9.8 | 11/10/93 | 17 | 35.3% |
| 12 | Chippewa Falls Waterworks | Chippewa Falls | WI | 12,989 | 9.7 | 8/30/93 | 1 | 100.0% |
| 13 | Hillcrest Wc-1,2,3&4 | Yuba City | CA | 10,062 | 9.6 | 7/25/95 | 6 | 33.3% |
| 14 | City Of Fresno | Fresno | CA | 390,350 | 9.6 | 8/31/94 | 312 | 17.6% |
| 15 | Garden City, City Of | Garden City | KS | 24,097 | 9.5 | 5/9/94 | 27 | 22.2% |
| 16 | Ottumwa Water Works | Ottumwa | IA | 24,488 | 9.5 | 5/1/95 | 14 | 50.0% |
| 17 | Lca-Wlsa Central Division | Wescosville | PA | 17,285 | 9.4 | 6/21/94 | 244 | 95.9% |
| 18 | Bucks Co Water And Sewer Auth | Warrington | PA | 16,200 | 9.4 | 12/26/93 | 3 | 33.3% |
| 19 | LaCrosse Waterworks | La Crosse | WI | 51,000 | 9.4 | 12/15/93 | 1 | 100.0% |
| 20 | Decatur | Decatur | IL | 83,885 | 9.4 | 6/6/95 | 134 | 43.3% |
| 21 | Cuc-Suburban | Sacramento | CA | 32,000 | 9.3 | 2/16/95 | 69 | 14.5% |
| 22 | City Of Davis | Davis | CA | 48,250 | 9.3 | 7/26/95 | 116 | 13.8% |
| 23 | City Of Bakersfield | Bakersfield | CA | 57,740 | 9.3 | 10/3/94 | 62 | 8.1% |
| 24 | West San Bernardino Cwd | Rialto | CA | 41,454 | 9.3 | 3/6/95 | 34 | 50.0% |
| 25 | Bloomington | Bloomington | IL | 52,000 | 9.3 | 5/30/95 | 63 | 41.3% |
| 26 | City Of Downey | Downey | CA | 91,000 | 9.2 | 2/17/93 | 53 | 3.8% |
| 27 | Northampton Bucks Co. Mun Auth | Richboro | PA | 30,000 | 9.2 | 9/8/94 | 40 | 2.5% |
| 28 | Metropolitan Water Co | Tucson | AZ | 36,250 | 9.2 | 12/23/93 | 109 | 6.4% |
| 29 | City Of Rialto | Rialto | CA | 48,418 | 9.1 | 12/7/93 | 131 | 27.5% |
| 30 | Oxnard Wd | Oxnard | CA | 146,571 | 9.1 | 6/22/95 | 23 | 17.4% |
| 31 | Del Este | Modesto | CA | 11,851 | 9.1 | 5/12/93 | 8 | 37.5% |
| 32 | Chester Water Authority | Chester | PA | 110,000 | 9.1 | 1/21/94 | 11 | 45.5% |
| 33 | City Of Anaheim | Anaheim | CA | 286,680 | 9.0 | 8/9/95 | 136 | 22.8% |
| 34 | Penn State Univ. | University Park | PA | 37,000 | 8.9 | 7/13/94 | 45 | 37.8% |
| 35 | Il American Wtr Cmpny - Pekin | Pekin | IL | 39,000 | 8.9 | 7/19/94 | 34 | 11.8% |
| 36 | San Jose Water Company | San Jose | CA | 921,000 | 8.9 | 5/17/93 | 264 | 11.4% |
| 37 | City Of Ceres | Ceres | CA | 28,988 | 8.9 | 2/2/95 | 8 | 50.0% |
| 38 | City Of Delano | Delano | CA | 29,944 | 8.9 | 8/10/93 | 47 | 53.2% |
| 39 | US Army Fort Irwin | Fort Irwin | CA | 16,000 | 8.8 | 2/14/95 | 42 | 26.2% |
| 40 | Security W & SD | Colorado Springs | CO | 10,007 | 8.8 | 4/3/95 | 80 | 93.8% |
Role of Water Utilities
To their credit, water suppliers with nitrate contamination problems frequently solve problems before they are officially considered to be in violation of EPA standards. In some cases individuals in these communities, including vulnerable infants were likely served water with unsafe concentrations of nitrate, even as water suppliers took aggressive measures to ensure that citizens in these communities could drink water that met EPA standards. Based on published estimates of the cost to fix nitrate problems in California and Iowa (Huber 1992, Anton et al. 1988), we estimate that nationwide, ratepayers spend more than $200 million per year to protect infants from nitrate contaminated water. Polluters, of course, pay none of these costs.
Solutions on the Farm
Farmers will, and must, continue to use nitrogen fertilizer. They do not, however, have to overuse it. Each year, there are 8 billion pounds more nitrogen available in farm fields than can be used by the crops growing on this land (NRC 1993). This excess nitrogen has to go somewhere, and much of it ends up in drinking water supplies (NRC 1989, NRC 1993, Hallberg 1989). Other sources such as sewage treatment plants, septic tanks, and atmospheric deposition pale in comparison to the farm contribution.
By following a few simple guidelines -- accounting for all sources of nitrogen in a field (manure and nitrogen fixing crops), timing applications properly, using nitrogen soil tests, and setting realistic yield goals -- farmers can dramatically reduce nitrogen application rates, while maintaining profits and high yields (NRC 1989; NRC 1993; Hallberg and Keeney, 1993; Hallberg, et al. 1991). In Iowa, farmers have successfully implement such a plan and reduced their use of nitrogen-based fertilizers while maintaining high yields (Hallberg et al 1991, Iowa State University 1993).
In the four years from 1991 through 1994, Iowa farmers used eighteen percent less fertilizer per acre of corn than farmers in other Corn Belt states -- and had a corn yield that matched those same Corn Belt farmers. In fact, statewide, Iowa corn growers achieved record yields in 1992 and 1994.
Recommendations
Congress is rewriting laws that regulate nitrate and other contaminants in drinking water. Amendments to the Safe Drinking Water Act passed by the Senate in November 1995, would make nitrate contamination problems even worse. The new legislation would give states and communities no new powers to prevent polluters from fouling tap water supplies, and would prevent them from taking action until it is too late: when contaminants have already exceeded standards. In the House, many members seem poised to support a weaker Safe Drinking Water Act. A Clean Water Act rewrite that passed the House in 1995 would roll back basic water quality protections.
To protect the tens of thousands of infants exposed to unsafe nitrate contamination in drinking water, we recommend that the EPA and the Congress:
- Immediately establish a new drinking water standard for nitrate of 5 ppm. This new standard -- which would be comparable to standards already established in Germany and South Africa -- would provide a modest two fold safety factor for the infant population.
- Adopt tough source water protection provisions when amending the Safe Drinking Water Act and the Clean Water Act, giving water suppliers and public health officials clear authority to stop pollution at its source and avoid the danger and expense caused by nitrate contamination of water supplies.
- Provide technical and financial assistance to farmers to help them improve the efficiency and consistency of their nutrient use to reduce nitrate contamination of source water.
- Require states to report cases of methemoglobinemia to the Centers for Disease Control.
We believe Congress and the EPA should take steps to protect against nitrates in drinking water, including:
- Establishing a more protective standard for nitrate in drinking water,
- Adopting tough source water protections in the Safe Drinking Water Act and Clean Water Act,
- Providing technical and financial assistance to farmers to help them reduce nitrate contamination of source water.
Acknowledgments
Environmental Working Group dedicates Pouring It On to Joe Schwartz, in honor of his past and continuing commitment to protecting public health and the environment.
Special thanks to Molly Evans who designed and produced the report, and to Allison Daly for coordinating the release of Pouring It On. We are grateful to Ken Cook for his editing and insight.
We would also like to thank the following individuals for their review of all or part of the early drafts of this report, and their assistance in improving the final version. We have made every effort to respond to their comments, and to double-check the data and analyses presented herein. Any errors in this report, however, are the authors', and should in no way reflect on the reviewers listed below. Names and organizations are presented for identification purposes only, and are not meant to indicate that the individual or organization has in any way endorsed the recommendations of this report.
Dr. Burton Kross, Director, Center For International Rural and Environmental Health, University of Iowa.
Dr. William Pease, School of Public Health, University of California at Berkeley
Dr. George Hallberg, University of Iowa Hygienic Laboratory
Dr. Amadu Ayebo, Center For International Rural and Environmental Health, University of Iowa.
Dr. Cynthia Bearer, Case Western Reserve University, Cleveland, Ohio.
Pouring It On was made possible by grants from The Pew Charitable Trusts, The Joyce Foundation, the Florence and John Schumann Foundation, and the Ford Foundation. A computer equipment grant from the Apple Computer Corporation made our analysis possible. The opinions expressed in this report are those of the authors and do not necessarily reflect the views of The Pew Charitable Trusts or other supporters listed above.
Copyright February 1996 by the Environmental Working Group/The Tides Foundation. All rights reserved.
Environmental Working Group
The Environmental Working Group is a nonprofit environmental research organization based in Washington, D.C. The Environmental Working Group is a project of the Tides Foundation, a California Public Benefit Corporation based in San Francisco that provides administrative and program support services to nonprofit programs and projects.
Kenneth A. Cook, President
Mark B. Childress, Vice President for Policy
Richard Wiles, Vice President for Research
Health Effects of Nitrate Exposure
For 50 years, physician and public health professionals have known that exposure to high levels of nitrates causes "blue baby syndrome," a condition caused by lack of oxygen in infants. Thousands of cases of this condition have been reported worldwide since its initial diagnosis in 1945, and the current EPA standard has been set in order to protect infants from methemoglobinemia from excessive exposure to nitrate. Unfortunately, in tens of thousands of households, infants continue to drink water contaminated with nitrate at levels deemed unsafe by EPA. And quite likely, the current EPA standard does not adequately protect the public health. The current EPA standard of 10 ppm1 is based on a 45 year old survey of methemoglobinemia in infants. Since 1950, however, there have been a number of reported cases of methemoglobinemia caused by nitrate at less than 10 ppm in drinking water (Sattelmacher 1964; Simon 1962).
Comparing EPA's nitrate in water standard with other nitrate standards illustrates just how out of step the water standard really is.
- In 1980, the USDA established a zero-tolerance for added nitrate in food destined for infants and children,2 and significantly restricted exposure to nitrate in the overall food supply. Unfortunately, this provides no protection for bottle fed infants during the first three to four months of life. This is precisely the time when infants, the most vulnerable population, are at peak susceptibility to the toxic effects of nitrate.
- In Germany and South Africa the drinking water standard for nitrate is 4.4 ppm -- more than twice as strict as the U.S. standard of 10 ppm (Kross, et al. 1995). The European Economic Community has established a nitrate health guideline of 5.6 ppm, and studies of infants in Europe have found that three to four percent of methemoglobinemia cases in infants occurred at doses lower than 10 ppm (Sattelmacher 1964; Simon 1962). Clearly, health authorities in many other countries believe that nitrate poses an unacceptable risk to infants and children below the current EPA standard of 10 ppm.
- Most European countries have banned N-nitrosamines and N-nitroso compounds, along with their nitrate and nitrite precursors from baby bottle nipples due to concern about exposure to these potent carcinogens early in life (Westin 1990). In the U.S., there is no standard, although Mead Johnson, a large producer of infant formula and infant products including baby bottle nipples, reformulated their nipples to remove all N-nitrosamines and precursors.
Unlike virtually all other contaminant standards, the drinking water standard for nitrate contains no margin of safety. Nearly every chemical standard in force today incorporates a ten to 100-fold safety factor to ensure that sensitive members of the population are adequately protected. When there is evidence of possible human carcinogenicity, the EPA adds yet another ten-fold safety factor. The nitrate standard contains no safety factors at all, even though it is targeted towards an especially sensitive population subgroup, infants, and even though nitrate is a precursor compound in the formation of N-Nitroso compounds, many of which are human carcinogens (NRC 1995).
In 1977, the Safe Drinking Water Committee of the National Academy of Sciences, concluded that:
"there appears to be little margin of safety for some infants with the standard at this concentration." (NAS, 1977)
Ten years later, during their review of the proposed 10 ppm standard, the Science Advisory Board of the Reagan Administration EPA had an even harsher assessment, finding that:
"The Agency selects a margin of safety that excludes, for all practical purposes, protection of sensitive members of the population." (Carlson 1987)
The EPA failed to heed this advice and has not added a safety factor to the nitrate standard, arguing that the current standard, which was based on a 45 year-old study of 278 reported cases, is representative of the full range of vulnerability of the infant population of the United States, and that no safety factor is required.
A recent panel of the National Academy of Sciences (NAS 1995) concluded that the 10 ppm standard was adequate to protect public health. This panel, however, ignored the evidence from two international studies (Simon, et al. 1962; Sattelmacher 1964) showing that methemoglobinemia occurred at concentrations below 10 ppm. The bulk of the committee's work then focused on cancer risk. It concluded that:
- While average levels of nitrate exposure in the United States are unlikely to significantly elevate an individuals' cancer risk, tens of thousands of infants are exposed to highly contaminated water with nitrate concentrations far above the national average.
Further, the committee's own calculation showed that: - Infants being bottle fed with highly nitrate contaminated water would receive a dose of nitrate 80 times higher than the average infant in the population.
The increased risks posed by this exposure were completely sidestepped by the panel even though widely respected animal studies with nitrosamine compounds show that exposure during infancy increases the cancer risk from N-nitroso compounds by a factor of six (Gray et al 1991).
The NAS study acknowledged 27,000 infants drinking water contaminated with nitrate in excess of the federal 10 ppm standard, but then failed to assess whether any increased cancer risk would be associated with such elevated nitrate exposure immediately after birth.
Ultimately the committee undermined its own conclusion that the 10 ppm standard is adequate by recommending that:
"limiting infant exposure to nitrate would be a sensible public health measure. It could be accomplished by minimizing exposure to both foods and water that are high in nitrate..." (NAS 1995 p. 49)
Lastly, the committee recommended further study of possible developmental effects for infants exposed to nitrate. The uncertainties acknowledged by the committees are more than enough to warrent a modest, two-fold safety margin in the current 10 ppm standard.
The Health Effects of Nitrate
A review of available peer reviewed literature on nitrate toxicity reveals a near systematic failure of the EPA to incorporate current scientific knowledge into drinking water standards. These shortcomings apply to all the toxic effects of nitrate, including:
- Methemoglobinemia. Nitrate causes methemoglobinemia in infants and this has been the principle health concern of regulators around the globe. The U.S. standard for nitrate is two times weaker than the standard in Germany and South Africa, and nearly twice as permissive as guidelines set by the European Community.
- Cancer. Nitrate is converted to nitrite after ingestion, and this nitrite reacts with both natural and synthetic organic compounds to produce N-Nitroso compounds in the human stomach. Many of these N-Nitroso compounds are carcinogenic in humans (IARC 1978, NAS 1977), and numerous researchers and a substantial body of literature suggest that high nitrate levels in drinking water may increase cancer risks (Mirvish 1983, Mirvish 1991). To date, the EPA has completely ignored the contribution of nitrate in drinking water to the human cancer risk from N-Nitroso compounds.
Infant exposure, particularly when nitrate levels approach the 10 ppm standard, appears to be especially important. Recent animal studies have shown that rats exposed to N-Nitrosodiethylamine during infancy are six times more likely to develop cancer than those exposed after weaning (Gray et al 1991). Human epidemiology studies also have suggested that cancer risks may be higher for those exposed to nitrate contaminated water in the first ten years of life (Cuello 1976).
- Disruption of thyroid function. An important study by Danish researchers found that individuals drinking water with a high nitrate content exhibited a dose related increase in hypertrophy, a condition marked by enlargement of the thyroid, the gland responsible for many of the body's endocrine and hormonal functions (Van Maanen, et al. 1994).
- Birth Defects. At least five studies have indicated a possible link between exposure to nitrite, nitrate and N-Nitroso compounds and birth defects. The effects of exposure were first observed in animal studies, but have since been observed in human epidemiological studies (Dorsch 1984; Knox 1972; Super 1981).
Given the litany of health effects associated with nitrate exposure and the uncertainty that this volume of evidence brings to the prediction of health risks, sound scientific judgment dictates that the U.S. EPA apply a safety factor of at least two to the current 10 PPM standard for nitrate-nitrogen in drinking water.
The EPA should further establish a Maximum Contaminant Level Goal of 3 ppm nitrate-nitrogen in drinking water, equal to the generally accepted maximum background level of uncontaminated groundwater aquifers used for drinking water in the U.S. This would allow the EPA to at least establish the goal of maintaining ground and surface water resources used for drinking water free from added nitrate contamination.
Nitrate and Methemoglobinemia
Methemoglobinemia, or blue-baby syndrome, is a condition caused by the inability of the blood to deliver enough oxygen to the body. It is the most well-known effect of exposure to elevated levels of nitrate in drinking water.
When nitrate is ingested it is converted to another chemical form, nitrite. Nitrite then reacts with hemoglobin, the proteins responsible for transporting oxygen in the body, converting them to methemoglobin, a form that is incapable of carrying oxygen. As a result, the affected individual suffers from oxygen deprivation.
Infants under four months of age are most susceptible to methemoglobinemia because their stomach is relatively non-acidic, meaning that compared to adults more nitrate is converted to nitrite in the infant stomach, and because infant or fetal hemoglobin reacts to form methemoglobin easier than adult hemoglobin. Diarrhea and other gastric disturbances (often caused by microbial contamination of drinking water) are also thought to play an important role in methemoglobinemia, perhaps because they increase stomach pH and weaken immune systems (NAS 1978). Virtually all reported cases of methemoglobinemia have involved children under the age of six months suffering from gastric disturbances.
Symptoms of methemoglobinemia include anoxic appearance, shortness of breath, nausea, vomiting, diarrhea, lethargy, and in more extreme cases loss of consciousness, and even death. Approximately seven to ten percent of all reported methemoglobinemia cases have resulted in death of the infant, and in recent years at least one death has been reported in the United States (NAS 1977, Johnson et al. 1987). Additional deaths caused by nitrate contaminated drinking water in the United States have almost certainly occurred, but gone unreported (Johnson and Kross 1990).
The Current EPA Standard Has No Safety Factor
The current enforceable drinking water standard (Maximum Contaminant Level or MCL) for nitrate as nitrogen (N) of ten parts per million (ppm) is unique for at least two reasons: (1) unlike most MCL's, which are based on the results of animal studies, the nitrate standard was set based on data from infants reported in a 1951 study of methemoglobinemia occurrence published in the American Journal of Public Health (Walton 1951); and, (2) unlike virtually all other water and food standards based on human data, which use at least a 10 fold safety factor to account for differences in human susceptibility to the toxicant in question, the 10 ppm standard for nitrate has no safety factor at all.
The Walton study analyzed 278 reported cases of methemoglobinemia that occurred in the United States between 1945 and 1950 and found that none of the reported cases occurred at nitrate concentrations below 10 ppm. On the basis of this study, 10 ppm of nitrate as nitrogen (N) was established as the "safe" dose of nitrate in drinking water for infants. In 1962 the American Public Health Service formally recommended a 10 ppm nitrate standard in drinking water, based on the Walton research. This same analysis was relied upon by the EPA during the 1987 MCL standard setting process.
Two retrospective German studies found that 3-4 percent of the reported methemoglobinemia cases in that country occurred at nitrate concentrations of 11 ppm or less (Sattelmacher 1962; Simon 1964). Infants suffering from gastric disturbances, respiratory illness, or diarrhea are particularly sensitive to methemoglobinemia and virtually all reported cases have involved this sensitive subpopulation.
In addition to infants, other populations may be more susceptible to the effects of elevated nitrate. These include African Americans, Alaskan Eskimos, and Native Americans, who lack a hereditary enzyme that helps reduce methemoglobin levels in the blood (NAS 1978; Aldrich 1980) as well as individuals suffering from stomach conditions such as gastric ulcers, pernicious anemia, adrenal insufficiency, gastritis, or gastric carcinoma, all of which reduce stomach acidity and cause more nitrate to be converted to hazardous nitrite (NAS, 1978). Pregnant women, with naturally high levels of methemoglobin in the latter period of their pregnancy, may also be sensitive to the effects of nitrate (Kross 1994, NAS 1977). A final group that is particularly sensitive includes dialysis patients, who are uniquely susceptible to methemoglobinemia. For water used for dialysis, a standard of 2 ppm has been recommended because of this sensitivity (Carlsen and Shapiro 1970, Fan et al. 1987).
There have been no estimates of the total size of the nitrate sensitive subpopulation, although it is quite large -- studies have indicated that enzyme deficiencies affect approximately 7 percent of African American males (Aldrich, 1980) -- a population of over one million, and over 140,000 people receive dialysis treatment each year (USRDS 1994).
In addition to the known sensitive populations, a recent reported case of methemoglobinemia in Wisconsin also provides cause for concern (MMWR 1993). In this case, an infant was hospitalized due to acute methemoglobinemia. When testing of the tap water was conducted, the nitrate concentration of the well water was found to be 9.9 ppm -- below the current EPA standard. The well was also found to be contaminated with copper, and the case was thought to have been caused by a synergistic effect of copper and the nitrate acting together.
A final cause for concern is that some baby foods contain naturally occurring nitrate. A recent study found that a number of baby foods, including bananas, carrots, garden vegetables, spinach, green beans, and beets, contain high concentrations of nitrate (Dusdieker, et al 1994). A young infant drinking contaminated water and eating commercial baby food that is also high in nitrate can easily exceed acceptable intake levels and become ill. The current EPA standard contains no safety standard to account for this simultaneous consumption of nitrate in food and drinking water.
The No Safety Approach Is Invalid
In theory, drinking water standards with no safety factors could be set based on human data, if the sample sizes for the study were large enough and statistically designed to capture all of the variability in the exposed human population.
The nitrate standard is based on a single 45 year-old study of 278 reported cases of methemoglobinemia in infants. It is inappropriate for two reasons. First, the sample size is far too small to account for the variable sensitivity of the entire U.S. population. And second, the standard fails to account for a number of confounding factors, including the fact that infants are also exposed to nitrate in food, and that exposure to nitrate may cause additional long-term health problems in addition to methemoglobinemia.
EPA justifies the absence of a safety factor by arguing that the Walton study is in fact a study of sensitive infants, because the condition of methemoglobinemia only occurs in sensitive infants. Therefore, according to the EPA, the fact that methemoglobinemia was not reported at contamination levels under 10 ppm by Walton, proves that nitrate is not likely to afflict any infant anywhere at levels under 10 ppm, because the sensitive infants in this study accurately represent the sensitivity to nitrate of all infants in the United States.
Several facts contradict this assertion. First, the study is only of reported cases, which, according to most medical experts, underrepresents the total number of cases. Methemoglobinemia is underreported because reporting is often not required, and because the symptoms mimic other conditions including congenital heart conditions, and even sudden infant death syndrome (Johnson and Kross 1990). As the National Academy of Sciences found in their recent study, "...the absence of reported cases [of methemoglobinemia below 11.3 ppm] might in part be due to the lack of requirements for reporting cases..." (NAS 1995)
And second, scientific data document methemoglobinemia at doses below 10 ppm (Sattelmacher 1964; Simon 1962). At a minimum, in order to fully justify not adopting a safety factor for nitrate, the EPA must lower the MCL to the lowest dose at which methemoglobinemia occurred in the infants in these more recent studies.
Methemoglobinemia Occurrence is Vastly Underreported
The only two surveys conducted in the last 15 years indicate that only a small percentage of methemoglobinemia cases are reported or publicized. In 1974, a Nebraska researcher noted that there had been no cases reported in the literature, and set out to determine if it was due to lack of occurrence (Grant 1981). A survey was sent to 910 physicians in a 72 county area, 442 of whom included infants in their practice. This survey asked all physicians if they had seen a case of nitrate induced methemoglobinemia, and reported that 33, or seven percent, had seen a case in the period 1973-1978. During that time not a single case had been reported in the medical literature.
A similar survey was carried out after a nitrate contaminated well caused the death of an infant by methemoglobinemia in South Dakota (Johnson, et al. 1987). The author sent questionnaires about methemoglobinemia to all doctors in the 12 county area of the Big Sioux aquifer. The survey found that many cases of methemoglobinemia went unreported (Meyer 1994). Although this was only the second reported case in South Dakota history, doctors reported that they had treated at least 80 cases in the period 1950-1980 -- in a region that comprises only 0.28% of the U.S. population. The study concluded that "the common perception that methemoglobinemia occurs rarely may be wrong..."
A 1994 study noted succinctly that "signs of methemoglobin-emia...may be difficult to detect in an infant by a caretaker or an unsuspecting physician" (Dusdieker 1994) and in a 1990 review, researchers in Iowa and South Dakota concluded that many cases of preventable nitrate poisoning were still occurring. They reported that:
"the contamination of ground and rural drinking water supplies by nitrates...continues to be a serious potential hazard throughout the world. Nitrate poisoning certainly contributes to national infant death rate statistics." (Johnson and Kross 1990)
Other Consequences of Nitrate Exposure
Although methemoglobinemia is the most immediate life threatening effect of nitrate exposure, there are a number of equally serious longer-term, chronic impacts. In numerous studies, exposure to high nitrate drinking water has been linked to a variety of effects ranging from hypertrophy (enlargement) of the thyroid, to 15 different types of cancer to two kinds of birth defects and even to hypertension. All of these effects have been observed in human epidemiology studies, and are often supported by further human physiology or animal studies. These results indicate that the current MCL does not provide adequate protection against chronic effects of exposure to elevated concentrations of nitrate.
In 1978, food regulations, set by the USDA, were strengthened in order to reduce the risk from nitrite and nitrate present in cured meats. Since 1978, only 120 ppm nitrite has been allowed in nitrite preserved products, and these products also must contain either ascorbate or erythorbate, two compounds that prevent the formation of hazardous N-Nitroso compounds. This has reduced exposure to hazardous nitrites by a factor of five or more (Mirvish 1991). And most importantly, current USDA regulations specifically ban the use of added nitrate or nitrite in "baby, junior, and toddler foods" (CFR 9 at 318.7).
Nitrate and Hypertrophy of the Thyroid
A recent study by Danish researchers revealed a strong correlation between prolonged exposure to nitrate contaminated water causes hypertrophy of the thyroid, the gland responsible for many of the body's endocrine and hormonal functions (van Maanen, et al. 1994). The study compared three dose groups -- low nitrate (0 ppm nitrate in drinking water), medium nitrate (4-10 ppm) and high nitrate (> 10 ppm) -- and found that "a dose-dependent difference in the volume of the thyroid was observed between low and medium vs. high nitrate exposure groups, showing development of hypertrophy at nitrate levels exceeding [11.3 ppm]". Adding further weight to the human epidemiological evidence, the researchers also noted that similar effects had been observed in laboratory animals, where nitrate interfered with the uptake of iodine by the thyroid.
Nitrate, Nitrite, Nitrosamines and Cancer
For many years, public health professionals have known that nitrate has the potential to form carcinogenic compounds when it reacts with naturally occurring materials (NAS 1977, 1978; Mirvish, 1991, 1983). Historically, however, there has been uncertainty over the risk posed by nitrate in drinking water, in large part because of questions over the relative importance of the dose of nitrate in water compared to larger amounts consumed via food, and a lack of understanding of the full series of reactions in the human body that lead to the formation of N-Nitroso compounds. Nonetheless, over the last 20 years, numerous human epidemiology and physiology studies (Table 6) as well as animal studies have shown a potential link between nitrate intake in water and increased risk of cancer.
Table 6: Eight human epidemiology tests in 11 countries show a link between nitrate consumption and cancer
| Author | Country | Finding |
| Gilli, 1984 | Italy | High water nitrate regions have a higher risk of stomach cancer. |
| Clough, 1983 | Britain | For men, gastric cancer rates associated with water nitrate intake. |
| Armijo, 1975, 1981 | Chile | Gastric cancer associated with fertilizer use. |
| Cuello, 1976 | Colombia | Gastric cancer associated with water nitrate intake. Particularly high risk for those exposed early in life. |
| Weisenburger, 1990 | USA | Non-Hodgkin's Lymphoma associated with nitrate or pesticide contamination of drinking water wells. |
| Haenszel, 1976 | Japan | Gastric cancer associated with drinking well-water which is generally higher in nitrate. |
| Jensen, 1982 | Denmark | Region of high water nitrate intake associated with increased gastric cancer risk. |
Evidence from animal and human studies suggests that exposure to elevated levels of N-Nitroso compounds during infancy can significantly increase lifetime cancer risks (Cuello, et al 1976; Gray, et al. 1991). While questions do remain over the link between nitrate in drinking water and cancer, prudent public health principles and the evidence of potential carcinogenic effects provide strong support for an additional safety factor in the nitrate standard.
Nitrate itself is not carcinogenic, but instead acts as a "procarcin-ogen", meaning that it reacts with other chemicals to form carcinogenic compounds via a multiple step process. First, nitrate is converted into nitrite after consumption. Second, the nitrite reacts with natural or synthetic organic compounds (known as secondary amines or amides) in food or water to form new combinations, called N-Nitroso compounds (either nitrosamines or nitrosamides), many of which are carcinogens. In animal or human studies, this class of compounds has been associated with 15 different types of cancers, including tumors in the bladder, stomach, brain, esophagus, bone and skin, kidney, liver, lung, oral and nasal cavities, pancreas, peripheral nervous system, thyroid, trachea, acute myelocytic leukemia, and T and B cell lymphoma -- a wider range of tumors than any other group of carcinogens (Mirvish 1991). More than one hundred of these N-Nitroso compounds have been tested for carcinogenicity in animals, and 75-80% of them have been found to be carcinogens (NAS 1977).
There is strong evidence that many of these compounds are carcinogenic in humans. In 1978, the International Agency for Research on Cancer reviewed 11 N-Nitroso compounds for which adequate data was available, and concluded that all 11 "should be regarded for practical purposes as if [they] were carcinogenic in man" (IARC 1978). Citing several human epidemiological studies, the National Academy of Sciences noted that "there is no reason to suppose that man is not susceptible." (NAS 1977). In humans, the organs thought to be most at risk from cancers caused by nitrosamine formation are the stomach, esophagus, nasopharyngeal cancer, and cancer of the bladder.
Human Evidence that Nitrate in Drinking Water Can Cause Cancer
Epidemiology. Since 1976, at least 8 different human epidemiology studies conducted in 11 countries show a relationship between increasing rates of stomach cancer and increasing nitrate intake (Hartmann, 1983; Mirvish 1983).3 The National Academy of Sciences, in their recent study on Nitrate and Nitrite in Drinking Water, ignored the vast majority of these studies, arguing that for most adults, nitrogen intake via water was relatively small. Those conclusions do not hold true for infants and others with highly contaminated tap water.
Links between nitrate and cancer have been found in at least three separate European countries. A 1984 study in the Piemonte Region of Italy compared the incidence of gastric cancer in regions with high and low nitrate in drinking water. Researchers found a positive relationship between communities having a significantly elevated cancer risk and a high nitrate content (>4.5 ppm as nitrate) in their drinking water (Gilli 1984). High nitrate communities were 13 times more likely to have higher than average stomach cancer rates than low-nitrate communities. Although this study did not adjust for many social or medical risk factors, for historical changes in nitrate concentrations or for a variety of other factors, the data do provide statistically significant evidence across a broad geographical area consisting of more than 150 communities of a potential link between nitrate contaminated drinking water and stomach cancer.
In Britain, a 1985 study of 253 urban areas found a negative relationship between water nitrate levels and stomach cancer rates (Beresford 1985). However, EPA and others have criticized this analysis because nitrate concentration data and cancer occurrence data are not from the appropriate time period -- that is, that the study ignores the long latent period between nitrate exposure and cancer occurrence (ECETOC 1988; USEPA 1990).
An English study which overcame this problem did in fact find a positive relationship between nitrate content and stomach cancer in males, although no relationship was observed for females (Clough 1983). This study analyzed 43 districts and boroughs in the county of Kent with water nitrate concentrations ranging from 0 to 11 ppm nitrate as N, and reported that, for both males and females, an increase in nitrate concentrations was linked with an increase in stomach cancer occurrence. For both groups, a dose response relationship was observed for nitrate concentrations up to 7 ppm. For women, risks increased at higher concentrations, while for men, no further increase in risk was observed at higher concentrations. Women exposed at greater than 7 ppm had gastric cancer risks approximately 10 percent higher than women exposed at concentrations between 0 and 2.5 ppm. Men exposed at greater than 7 ppm had gastric cancer occurrence rates approximately 17 percent higher than women exposed at concentrations between 0 and 2.5 ppm. Notably, increases in cancer occurrence was were found at concentrations well below the current MCL.
A 1982 study in Denmark also found a link between nitrate exposure and occurrence of stomach cancer. This study compared stomach cancer rates in Aalborg, a town with approximately 5-7 ppm nitrate in drinking water, with surrounding communities that had lower nitrate concentrations. Stomach cancer rates in the high nitrate region were approximately 25% higher than in the low nitrate region. Although the authors only compared cancer rates in two communities, and did not control for many outside factors, this study did support a possible link between nitrate exposure and stomach cancer. The author concluded that, while the results did not provide proof of a link between water nitrate and cancer, they did "support the hypothesis of a possible role for nitrate in the etiology of stomach cancer" (Jensen 1982).
Three epidemiology studies in South America have shown an association between high rates of gastric cancer and nitrogen fertilizer use, nitrate intake, or nitrate contaminated water on cancer rates (Armijo 1975,1981; Cuello 1976). Perhaps the most compelling was a study of the incidence of stomach cancer rates in Narino, Colombia -- the first to link nitrate exposure via water and stomach cancer -- published in the Journal of the National Cancer Institute in 1976. This research compared nitrate content of well water with gastric cancer risk, finding a significant correlation between the two. Even more disturbing were data in the study showing that cancer occurrence rates were higher for members of the population using wells (which generally had higher nitrate content) at a young age, between 0 and 10 years old. The authors noted in their abstract that the "data could be construed as presumptive epidemiologic evidence for the role of nitrate availability in the etiology of stomach cancer" (Cuello 1976).
A 1992 study conducted in China showed a link between nitrate exposure in drinking water and gastric cancer (Xu, et al. 1992). This study, which was based upon determinations of exposure and disease for individuals rather than groups, found that individuals at higher risk for gastric cancer had an average exposure to nitrate in drinking water that was more than twice as high as individuals at lower risks. These findings led the authors to conclude that "the results suggest that nitrate in drinking water probably plays an important role in gastric carcinogenesis."
Finally, a recent epidemiological study of nitrate in well water in Nebraska showed an association between nitrate contamination and a different kind of cancer, non-Hodgkins lymphoma (Weisenburger 1990). As noted previously, N-Nitroso compounds have been found to cause cell lymphomas in animal studies. The study, which was designed to suggest possible factors in the increased incidence of non-Hodgkins lymphoma in many regions of Nebraska, reported that NHL incidence was twice as high in counties where more than 20% of the wells were contaminated by nitrate or in the 33% of counties with highest fertilizer use. Previous studies also found relationships between pesticide use and NHL, leading the authors to conclude that "these findings suggest that NHL in eastern Nebraska may be related to the use of pesticides and nitrogen fertilizers" (Weisenburger 1990).
Physiology. Although the evidence from the database of human epidemiology studies suggests a link between nitrate contamination and cancer, three critical human physiology studies add significant weight because they indicate that nitrate in water may contribute more than nitrate in food to total body burden of nitrite, and because they prove that the entire series of reactions necessary to convert nitrate into carcinogenic N-Nitroso compounds can occur in the human body.
In a 1982 study, researchers compared two groups, one drinking nitrate contaminated water (at 20 ppm) and another drinking water with lower levels of nitrate. The study found that salivary nitrate concentrations more than doubled and salivary nitrite concentrations quadrupled after drinking nitrate contaminated water, and noted that "ingestion of nitrate rich water can provide a steady and prolonged supply of nitrite to the gastric system" (Weisenberg 1982) A second noteworthy finding of the study was that the threshold for water affecting salivary nitrate was lower than the threshold for food. In previous findings, researchers had indicated a food threshold intake of approximately 13 milligrams nitrate before any increase in salivary nitrate was noted. However, Weisenberg, et al. (1982) reported that "the dose of nitrate ingested from water needed to increase the salivary nitrite seems to be much lower." This may be particularly important because salivary nitrite generally accounts for 75% of all exposure to hazardous nitrite or N-nitroso compounds (NAS 1977).
In a second study published in 1992, researchers at the University of Nebraska Medical Center were able to provide convincing evidence that nitrate consumed via drinking water could produce nitrosamines in the human body (Mirvish 1991). In the study, 44 Nebraska men were divided into two groups, one drinking well water high in nitrates (>18 ppm) and one group drinking well water lower in nitrate (<18 ppm). Each of these men was also given a small dose of proline, a compound which reacts with nitrite to form nitrosoproline (NPRO), a nitrosamine. During the study the researchers measured NPRO concentration in the urine and found that the high nitrate group had higher levels of NPRO, proving that drinking water high in nitrate can lead to increased production of carcinogenic nitrosamines in the human body. Similar results were observed in a Danish study of populations drinking water high in nitrate, leading those researchers to note that "it would seem well advised to reduce the intake of nitrate from drinking water." (Moller 1989).
These studies provide strong physiological evidence supporting the association between nitrate contamination of drinking water and increased cancer rates observed in the human epidemiology studies. They clearly indicate that nitrate ingested via water can undergo the full set of reactions needed to ultimately produce carcinogenic N-Nitroso compounds in the human body, and they further suggest that given an equal amount of nitrate in food and water, that nitrate in water may account for a proportionately greater amount of actual exposure to both nitrate and nitrite.
Nitrate, Infants, and Children: A High Cancer Risk? Just as children are more sensitive to methemoglobinemia than adults, there is strong experimental and epidemiological evidence to support the conclusion that infants, children, and the fetus, when exposed to nitrate, may face notably higher cancer risks later in life (Table 7).
Table 7: Human or animal studies indicating that exposure early in life can significantly increase cancer risks from nitrate exposure
| Author | Type | Finding |
| Druckrey, 1966, Givelber, 1969 | Animals | A single dose of an N-nitrosamide early in the pregnancy can cause birth defects in the offspring. |
| Shuval and Gruener, 1972 | Animals | Nitrite and N-Nitroso compounds can cross the placental barrier and affect fetal development. |
| Super, 1981 | Humans | Mothers exposed to elevated levels of nitrate in drinking water have higher rates of infant death in the first year of life. |
| Knox, 1972 | Humans | In Britain, consumption of foods high in nitrite was associated with birth defects (anencephaly). |
| Dorsch, 1984 | Humans | Consumption of water high in nitrate associated with birth defects of the musculoskeletal or central nervous system. A dose-response relationship was observed. |
There are several possible reasons for this higher sensitivity or risk in the young. Infants have a lower stomach acidity than adults, meaning that when nitrate is consumed in water more of it will be converted into the hazardous nitrite form. In addition, children drink more water per unit of body weight than adults -- bottle-fed infants subsist on a diet composed entirely of formula and water, and relative to body weight, the average infant drinks approximately seven times more tap water than the average adult.
A series of human and animal studies have indicated that infants, children, and even the fetus may face elevated risk later in life due to the effects of nitrate or nitrite exposure. Human epidemiology studies conducted in an area of high nitrate exposure in Colombia focused on the effect of nitrate exposure early in life. The study found that increases in stomach cancer rates were associated with consumption of well water high in nitrate and that individuals exposed during the first ten years of life formed a high risk group (Cuello et al. 1976).
Studies with N-Nitroso compounds on both fetal and infant equivalent animals support this finding. Research on rats has shown that nitrite is transported through the placental barrier and delivered to the fetus, and that a high dose of nitrate to the pregnant dam can cause subacute methemoglobinemia in fetal rats (Shuval and Gruner 1972). A second study showed the potential significance of fetal exposure to N-Nitroso compounds. In this case a single dose of a nitrosamide (ethylnitrosourea) given to the mother on the 15th day of the pregnancy was sufficient to cause rare malignant ocular tumors in the offspring. Significantly, these cancers occurred relatively early in the life of the offspring, indicating even greater potency for the compound than is suggested by the otherwise compelling fact that a single dose during gestation was sufficient to cause cancer in 100 percent of the surviving fetuses (Druckrey 1976).
Further reason for concern about infant exposure to nitrate comes from a massive study of 1,040 rats fed an N-Nitroso compound, N-Nitrosodiethylamine (NDEA).
This study was designed to determine a threshold for exposure below which no adverse effects occurred, but instead the authors found "no indication of any 'threshold'" for tumor formation (Peto et al., 1991). The investigation found that the N-Nitrosamines caused tumors of the liver and esophagus, with a strong dose-response relationship between the concentration of NDEA and the tumor formation rate.
In conjunction with this study, the authors examined the effects of age of initial exposure on cancer incidence (Gray et al. 1991). In this part of the study, the rats were broken into three groups with treatment starting at either three, six, or 20 weeks of age.
The results of this research showed that the initial age of exposure had a significant effect on liver tumor rates, and that young animals were particularly sensitive to the cancer causing effects of the chemical. After the same duration of exposure, rats starting treatment at three weeks of age had a cancer rate three times higher than rats starting treatment at six weeks, and six times higher than rats starting treatment at 20 weeks of age.
The authors reported that, although they could not identify the exact cause, their result:
"indicates a profound influence of nitrosamine treatment of the liver during the first few weeks of life on subsequent tumor onset rates, due to some temporary factors that greatly enhance the sensitivity of the organ." (Gray, et al 1991)
The National Academy of Sciences Conclusions on Nitrate and Cancer
In its recent report on nitrate in drinking water, a subcommittee of the National Research Council concluded that cancer risk from nitrate in drinking water is negligible. For most of the U.S. population, where nitrate contamination in drinking water is low, this assessment is likely accurate.
For this average person in the U.S. population, the subcommittee estimated nitrate consumption via drinking water at 2 mg per day, or three percent of daily exposure. Food exposure was estimated at 73 mg per day, or 97 percent of daily exposure.
In areas with high nitrate contamination, described as "nitrate-rich water4 " by the subcommittee, nitrate consumption via drinking water was estimated at 160 mg per day, or 69 percent of daily exposure. This exposure level is many times greater than the average exposure via drinking water, and contributes to a total daily exposure more than triple the average exposure.
The flaw in the committee's analysis is the failure to assess the increased cancer risk associated with high consumption of nitrate during the first years of life.
For newborns whose sole food source is infant formula reconstituted with nitrate-rich tap water, the exposure during the first six months of life would be 80 times greater than the average bottle fed infant. The committee made no assessment of the effect of elevated nitrate exposure during infancy on cancer risk other than to note that the epidemiological literature provides contradictory evidence of an association between high nitrate consumption in the general population and cancer risk. None of these studies cited by the committee examined the potential increase in risk associated with high nitrate consumption during infancy.
According to the subcommittee, five percent of nitrate ingested is converted to carcinogenic N-Nitroso compounds in the digestive tract. And there is reason to believe that exposure to N-Nitroso compounds during the first year of life present significantly higher cancer risks than exposure during other periods of life (see previous).
The question that the committee failed to address is: What is the increase in cancer risk for the infants subsisting on water based formula that is contaminated with nitrate at levels much higher than those deemed to present negligible risk over a lifetime. Reliable data indicate that early life exposure to N-Nitroso compounds significantly increases cancer incidence in rats. It follows that highly elevated early life exposure in humans might have the same effect.
Infants also lack vitamins in their diet that inhibit the formation of N-Nitroso compounds. Vitamin C and E found in many fruits and vegetables are known to inhibit the formation of carcinogenic N-Nitroso compounds. Consuming ample vitamin C and E can mitigate much of the potential cancer risk associated with a diet high in nitrate. Newborns drinking nitrate contaminated water have no such dietary defenses. This lack of risk mitigating components that are present in the adult diet may contribute to increased cancer risks from heavy nitrate exposure early in life.
Other Chronic Effects: Birth Defects and Hypertension
A number of other human or animal studies support two other potential adverse, chronic effects of nitrate exposure: birth defects and hypertension.
At least five studies have indicated a possible link between exposure to nitrite, nitrate and N-Nitroso compounds and birth defects. The effects were first observed in animal studies, but have since been observed in human epidemiological studies (Table 8).
Table 8: Human or animal studies indicating that nitrate, nitrite, or N-Nitroso compounds can cause birth defects
| Author | Type | Finding |
| Druckrey, 1966, Givelber, 1969 | Animals | A single dose of an N-nitrosamide early in the pregnancy can cause birth defects in the offspring. |
| Shuval and Gruener, 1972 | Animals | Nitrite and N-Nitroso compounds can cross the placental barrier and affect fetal development. |
| Super, 1981 | Humans | Mothers exposed to elevated levels of nitrate in drinking water have higher rates of infant death in the first year of life. |
| Knox, 1972 | Humans | In Britain, consumption of foods high in nitrite was associated with birth defects (anencephaly) |
| Dorsch, 1984 | Humans | Consumption of water high in nitrate associated with birth defects of the musculoskeletal or central nervous system. A dose-response relationship was observed. |
Studies in rats and hamsters have indicated that N-Nitroso compounds are potent teratogens (Druckery 1966; Givelber 1969). In both of these animals, multiple birth defects, including malformations of the eye, central nervous system, and musculoskeletal system, were observed when a single dose of N-Ethyl-N-Nitrosourea, a nitrosamine, was given to the mother.
Other studies have indicated that nitrite can be transferred from the mother to the fetus and could affect behavioral development at sublethal doses (Shuval and Gruener 1972). When pregnant rats were exposed to high nitrite concentrations in water, nitrite was transferred through the placenta, and resulted in high nitrite levels and subacute methemoglobinemia in the fetuses. The same study indicated that in pregnant rats exposed to sodium nitrite in their drinking water "a pronounced effect on mortality" of the infants in the high dose group (Shuval and Gruener 1972). This effect -- an increase in infant death rates -- has also been observed in human epidemiology studies. A study of African mothers exposed to elevated nitrate levels in their drinking water found that in an increase in infant deaths was associated with increasing exposure of pregnant mothers and infants to nitrate (Super, et al. 1981). This may have been either due to undetected toxic methemoglobinemia or to malformations and weaknesses in the infant caused by fetal nitrate exposure.
After these animal studies indicated the teratogenic effects of N-Nitroso compounds, a number of human epidemiology studies were conducted. The first, in 1972, attempted to compare rates of anencephaly (a birth defect causing severe brain malformation) with dietary intakes of a number of food products (Knox 1972). The clearest link was found between anencephaly rates and intake of cured meat containing high levels of nitrite, Over a ten year period, 1960-1970, anencephaly rates were closely linked to seasonal and yearly variations in national intake of cured meat products. This study provided the first suggestive evidence in humans that nitrite consumption in food could have adverse impacts on the fetus.
Later studies indicated that birth defects may also be caused by nitrate in water. A 1984 study of ground and surface water drinkers in South Australia analyzed birth defects in relation to nitrate contamination in drinking water and found statistically significant dose response relationships between birth defects of the central nervous system and musculoskeletal system and increasing nitrate concentration of drinking water (Dorsch, et al. 1984).
This study broke mothers into three groups, those consuming 0-1.1 ppm nitrate, those consuming 1.1-3.5 ppm of nitrate, and those consuming over 3.5 ppm of nitrate in their drinking water Women in the 1.1-3.5 ppm category experienced a threefold increase in risk of a birth defect, while women in the highest exposure category faced a fourfold increased risk. Interestingly, this study also found a seasonal gradient in risk, with greater risks occurring for conception during the spring and summer. The authors attributed this to the possibility of increased water consumption in the warmer months.
While the authors (and other critics of the work) have noted that, because of the design of the study, they could not exclude other causes besides nitrate, they discussed two factors that strengthened the association:
- The fact that a true dose-response relationship was observed, and
- Other studies that indicate, in humans or animals exposure to nitrate, nitrite, or N-Nitroso compounds is associated with birth defects.
Based on these findings, the authors concluded that
...the internal cohesion of our findings and their consistency with our earlier study and experimental evidence, lend weight to the possibility of a real association between groundwater nitrate consumption and malformations. (Dorsch, et al. 1984)
Based on the results of the Australian study, a similar follow-up study was performed attempting to link defects of the central nervous system with nitrate exposure via drinking water in New Brunswick, Canada (Arbuckle, et al. 1988). This study, although it did not contradict the results of the Australian study, found the evidence for an association between nitrate and birth defects to be weaker. In the study, no statistically significant risk relationship was found between CNS birth defects and nitrate exposure. The authors discuss a number of reasons for the variability in study results, including differences in sensitivity of the populations, biases in exposure estimates in the Australian study, and differences in levels of exposure between the Australian and Canadian groups.
Although both studies analyzed risks at exposure below the current MCL of 10 ppm, the majority of the Canadian population was not exposed above 3 ppm. Notably, when the relationship between nitrate exposure and birth defects was analyzed for two higher exposure subgroups of the population (well water drinkers and those in a high occurrence region, both of which were exposed at relatively high nitrate levels, although still below the MCL), moderate but not statistically significant increases in CNS birth defect rates were observed with increasing nitrate exposure. The authors of this study concluded that these results warranted further study, and that future studies must include a larger population exposed to higher nitrate levels.
The risk of birth defects due to nitrate exposure is a particular concern because of the fact that risk could be due to a single high dose of nitrate early in the pregnancy that later has profound effects on long-term fetal development. As noted previously, studies have indicated that N-Nitroso compounds are transported through the placenta to the fetus (Shuval and Gruener 1972) and that fetal exposure can cause cancer later in life (Druckrey 1966). The same author reported that a single dose of a nitrosamide given to pregnant rats on day 15 of the pregnancy can causes birth defects in the offspring.
Human epidemiology studies have also indicated a link between nitrate intake and hypertension. A 1971 study published in the American Journal of Public Health analyzed the risk of hypertension and hypertension mortality and found a positive relationship between hypertension and increased nitrate exposure through drinking water (Morton 1971). The study was designed with the goal of identifying the cause of a localized area of increased hypertension risk in eastern Colorado, and analyzed a number of drinking water parameters (hardness, sodium, nitrate and chlorine) in relation to this risk. Among the six watersheds that were analyzed, the strongest relationship was between elevated nitrate levels and increased hypertension. In the study, Republican River watershed residents, with the highest mean nitrate concentration at 3.1 ppm (3 times lower than the current MCL) had hypertension mortality rates that were more than twice the rates of the next highest region.
A second study, conducted seven years later, reported on eighteen communities in Weld County, Colorado (Mallberg 1977). This study separated community water supplies into a high-nitrate group and a low-nitrate group, and did not report any epidemiological evidence of increased hypertension with increased nitrate consumption. However, the study did provide some evidence supporting the initial findings. Among residents in the exposed communities, there was an earlier onset of hypertension, with the exposed group exhibiting a peak among the 50-59 age group that was not evident in the non-exposed communities.
Supporting these epidemiological findings, complementary evidence from workers exposed to high levels of organic nitrates appeared to strengthen the link. Among explosives industry employees exposed to high levels of nitrate in the workplace, a variety of adverse cardiovascular effects are observed, including elevated blood pressure, increased risk of angina pectoris, and sudden coronary death (Morton 1971).
Notes
1. Nitrate concentrations are generally reported in one of two ways: either measured as nitrogen, or measured as nitrate. The EPA standard of 10 ppm is based on nitrate measured as nitrogen. For conversions, this is equivalent to 45 ppm nitrate measured as nitrate. In this text, when referring to nitrate concentrations we are referring to nitrate measured as nitrogen. This is the format generally used by American scientists.
2. Although for infants eating baby food there may still be exposure from nitrate that occurs naturally in vegetables.
3. These studies were ecologic studies, meaning that groups of individuals, not the individuals themselves, were the subjects of the study.
4. Water that contains concentrations of nitrate-nitrogen approaching the current EPA standard of 10 ppm.
Nitrogen Use and Sources of Nitrate Contamination
In 1995, America's agricultural producers added 36 billion pounds of nitrogen to the environment -- 23 billion pounds of nitrogen fertilizer, and 13 billion pounds of nitrogen in the form of animal manure. Twenty percent of this nitrogen -- or 7 billion pounds -- was not used by the crops for which it was intended (NAS 1993). Instead, this excess nitrogen remained in the environment, where much of it eventually entered the reservoirs, rivers, and groundwater that supply us with our drinking water.
Nitrogen is a naturally occurring compound. In natural ecosystems nitrogen gains and losses are in balance, and remain so unless additional nitrogen is added to the system, upsetting the equilibrium. Unfortunately, in vast regions of the country, this balance has been upset, meaning water supplies are contaminated or placed at risk. The primary cause of this problem is the nitrogen that is added to the environment from agricultural activities, mainly overapplication of fertilizer.
Nitrogen Inputs From Agriculture
Agricultural activities, primarily row crop and livestock production, account for over 80 percent of all nitrogen added to the environment (Figure 1). Fertilizer is the single largest source of nitrogen; in 1995 American farmers used 23 billion pounds of nitrogen fertilizer, primarily for production of corn and wheat (Terry, et al. 1996). This represents a 25-fold increase in total annual nitrogen fertilizer use in the fifty year period between 1945 and 1994. Not surprisingly, nitrogen from fertilizer is considered to be the most important preventable source of nitrate contamination of water supplies (Hallberg 1986a, Bouchard 1992, NAS 1993, Puckett 1994, Keeney 1986, Keeney 1989). And not surprisingly, agricultural areas have the highest rates of nitrate contaminated water.
Figure 1: Agriculture accounts for over 80% of nitrogen input into the environment
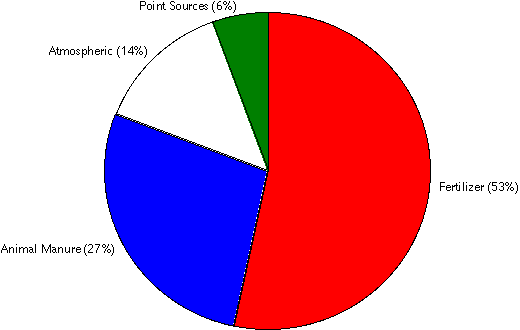
Source: USGS; Nonpoint and point sources of nitrogen in major watersheds in the U.S. (Pucket, 1994)
Animal manure is the second largest source of nitrogen in the environment, accounting for 13 billion pounds per year. When animals are confined to high density feedlots, the nitrogen produced can be an important localized source of water contamination. And, in many of the regions where manure input to the environment is highest, fertilizer inputs are also high, making what is often already a high risk situation even riskier.
Non-Agricultural Sources of Nitrogen
Non-agricultural sources of nitrogen contribute less than 20 percent of the nitrogen released into the environment. Six percent is released from point sources (basically pipes) into water bodies, while fourteen percent is deposited from atmospheric sources.
Point sources, primarily in urban watersheds, can cause significant localized nitrate problems in surface waters or individual wells. They are not responsible, however, for nitrate contamination problems on the scale of those caused by agriculture. A variety of point sources contribute approximately 2.6 billion pounds of nitrogen to the environment, primarily into surface waters, each year (Figure 1). Municipal sewage plants account for 80 percent of point source nitrogen discharges; individual septic tanks and a number of industrial sources account for the rest.
Nitrogen is also deposited in soil and water from the atmosphere, where it enters from an array of sources, primarily as nitrogen oxide emissions from coal or oil burning electric utilities or other industries (53 percent of atmospheric nitrogen emissions) or from automobiles, trucks or buses (38 percent of atmospheric emissions). And nitrogen enters the atmosphere as it volatilizes from manure or fertilizer. Each year, 3.2 million tons of atmospheric nitrogen are redeposited into watersheds in the United States, with the largest inputs in the northern and midwestern regions.
Agriculture Is The Major Source of Widespread Nitrate Contamination
Agriculture is the chief cause of widespread groundwater and surface water contamination with nitrate in the United States (Hallberg 1986a, Bouchard 1992, NAS 1993, Puckett 1994, Keeney 1986, Keeney 1989).
A 1990-91 national water quality summary analyzed nitrate transport in surface waters and land use and found that the highest transport rates occurred in corn and soybean production areas. This study found that the average annual yield of nitrate contamination1 on agricultural land was 0.93 tons per square mile. In contrast, the average yield in urban areas is significantly lower, 0.547 tons per square mile. Forest and rangeland had even lower annual nitrogen contamination yields, 0.26 and 0.03 tons per square mile per year (Smith and Alexander 1993). The impact of this discrepancy between urban and agricultural land as a source of nitrogen is even more dramatic when one considers how much more land is used in crop production than for urban space. Corn alone accounts for 12 times more land area than all urban land in the United States (Department of Commerce 1993). Nationally, agricultural regions contribute approximately 20 times more nitrate contamination to surface waters than does urban land. Similarly, corn and soybean acreage is responsible for 11 times more nitrate contamination than acreage used as rangeland.
In most regions, agriculture is also the major source of groundwater pollution with nitrate. In many areas where groundwater is heavily contaminated, there are few other significant sources of nitrate besides agriculture (Hallberg 1986). Regional scale studies have shown a three to sixty-fold increase in groundwater nitrate concentrations as land uses change from forest, to pasture or grass land, to agriculture (Hallberg 1989) Intensive studies over 40 years in the Corn Belt have shown that increases in groundwater contamination by nitrate correspond closely with increases in nitrogen fertilizer use (Hallberg 1989, Hallberg 1984, Figure 2). The most recent studies by the United States Geological Survey have found that groundwater wells in agricultural regions are much more heavily contaminated than wells in urban, forest, or rangeland regions (Mueller, et al. 1994).
Figure 2: Increases in nitrate contamination in Iowa groundwater correspond closely to increases in nitrogen fertilizer use
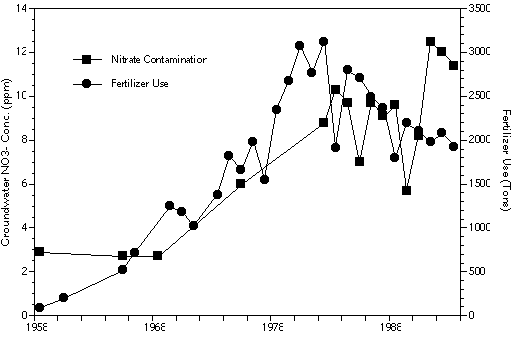
Source: Nitrate in groundwater in the U.S. (Hallberg, 1989, updated with 1993 data.)
Although a variety of factors, from urban sewage to atmospheric fallout, may be responsible for localized instances of nitrate contamination, on a regional and national scale nitrogen inputs from agricultural activities are the single most important source of ground and surface water problems.
A recent authoritative study of the problem concurred:
"although these [nonagricultural] sources can contribute to nitrate contamination of groundwater in any given area, there is a general consensus that agriculture activities constitute the most important anthropogenic source of nitrate..." (Bouchard, et al 1992)
Solving the nitrate contamination problem will require reducing and refining agricultural use of nitrogen fertilizer, as well as vastly improved management of manure, both as a point source of pollution and when used as a fertilizer in the field. Unfortunately, the most recent data indicate exactly the opposite trend. Instead of reducing their use of nitrogen fertilizers, America's farmers continue to increase nitrogen fertilizer use, thereby increasing production costs, environmental risks and the costs to taxpayers to solve contamination problems.
Fertilizer Use In The United States
Fertilizer Use Has Increased Dramatically Since 1945, Reaching An All Time High In 1994
Widespread, massive application of nitrogen based fertilizers is a product of the post-war era in American farming. Before 1945, little fertilizer was applied to U.S. cropland; over the next 15 years, farmers began to rely upon ever-larger amounts of fertilizer (Commoner 1977). By 1960, farmers were applying approximately 2.5 million tons of nitrogen fertilizer to their crops, and between 1960 and 1981, fertilizer use raced to a then-record high of 11.9 million tons (Figure 3; Berry 1994).
Figure 3: Nitrogen fertilizer use continues to increase, reaching an all-time high of 12.6 million tons in 1994
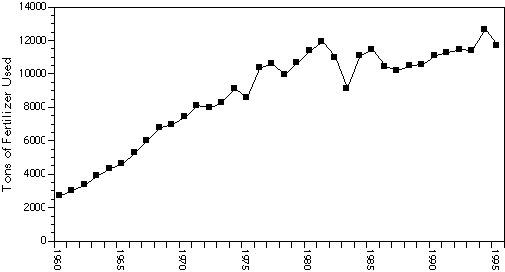
Source: Commercial Fertilizer Use: 1995 (Terry 1996)
Nitrogen fertilizer, along with high yielding seeds and chemical pesticides, was part of a package of inputs that produced dramatic productivity increases in the 1950s, 60s, and 70s. It is now generally agreed, however, that the continuing increases in fertilizer use provide diminishing yield gains, and present serious risks to the environment and human health (NRC 1989; NRC 1993). Throughout the 1980s and 1990s the rate of increased use slowed, but total fertilizer use continued to rise. In 1994, years after virtually all experts had recognized overuse of fertilizer as a threat to ground and surface waters, nitrogen fertilizer use in the United States reached an all-time high of 12.6 million tons (Berry 1994). In 1995, use dropped slightly again, to 11.7 million tons. This slight drop did little to dent the trend of continual increases in nitrogen fertilizer since 1945 (Terry 1996).
Nitrogen Use Is Heaviest In The Corn Belt
Nine of the top eleven nitrogen using states -- Iowa, Illinois, Nebraska, Minnesota, Kansas, Indiana, North Dakota, Ohio, and Missouri -- are in the Corn Belt, and 50% of the nation's fertilizer use occurs in these nine states (Table 9, Figure 3). Texas, which ranks first in the country in fertilizer use, and California, which ranks ninth, are the only non-Corn belt states among the top ten in fertilizer use Table 9.
Table 9: Nitrogen fertilizer use is heaviest in the Corn Belt, Texas, and California
| State | Tons Nitrogen Used |
|---|---|
| Alabama | 103,838 |
| Alaska | 3,391 |
| Arizona | 82,860 |
| Arkansas | 289,571 |
| California | 559,795 |
| Colorado | 159,300 |
| Connecticut | 8,042 |
| Delaware | 20,635 |
| Florida | 227,339 |
| Georgia | 224,494 |
| Hawaii | 16,828 |
| Idaho | 202,985 |
| Illinois | 884,438 |
| Indiana | 498,084 |
| Iowa | 883,477 |
| Kansas | 665,572 |
| Kentucky | 199,206 |
| Louisiana | 172,508 |
| Maine | 6,595 |
| Maryland | 73,172 |
| Massachusetts | 14,401 |
| Michigan | 264,572 |
| Minnesota | 632,101 |
| Mississippi | 168,260 |
| Missouri | 371,912 |
| Montana | 142,985 |
| Nebraska | 718,570 |
| Nevada | 7,071 |
| New Hampshire | 3,186 |
| New Jersey | 23,769 |
| New Mexico | 36,672 |
| New York | 99,933 |
| North Carolina | 222,770 |
| North Dakota | 576,819 |
| Ohio | 590,579 |
| Oklahoma | 321,323 |
| Oregon | 149,945 |
| Pennsylvania | 92,256 |
| Rhode Island | 1,715 |
| South Carolina | 84,589 |
| South Dakota | 172,398 |
| Tennessee | 166,596 |
| Texas | 886,603 |
| Utah | 28,139 |
| Vermont | 4,959 |
| Virginia | 97,406 |
| Washington | 222,876 |
| West Virginia | 8,089 |
| Wisconsin | 211,416 |
| Wyoming | 104,662 |
| National Use | 11,719,949 |
Source: Commercial Fertilizer Use: 1995 (Terry 1996).
Total nitrogen fertilizer use is lower in other regions of the country because less acreage is devoted to field crops. However, even in states outside the Corn Belt, fertilizer use can be extremely high on a local or regional basis. In the fruit and vegetable growing regions of central Florida, California, and the Atlantic Coastal Plain, as well as the corn growing regions of the Chesapeake Bay, nitrogen fertilizers are heavily used and contribute to significant nitrate contamination problems (Figure 4).
Figure 4: Overall nitrogen fertilizer use is concentrated in the Corn Belt
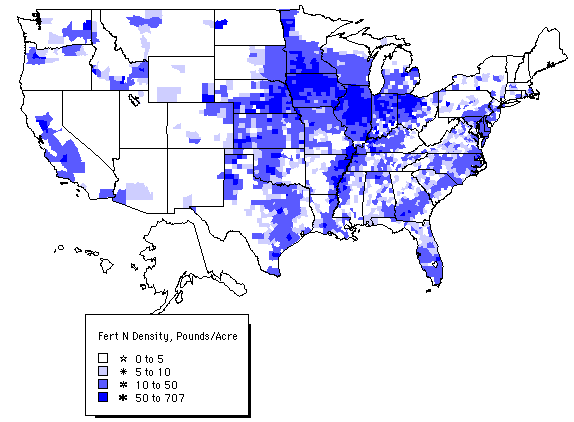
Source: Environmental Working Group, compiled from Berry, et al. 1995.
Fertilizer Use On Corn
Corn growers use more nitrogen fertilizer than producers of any other crop. Since the mid-1970s, at least 95 percent of the nation's corn acres have received nitrogen fertilizer each year, and in 1994 corn producers applied a total of 7.9 billion pounds of nitrogen to 62.5 million acres of corn, at an average rate of 129 pounds per acre (USDA 1995). This accounted for more than thirty percent of all national nitrogen fertilizer use. Fertilizer application rates were highest in Illinois, Ohio, and Indiana.
Nationwide, nitrogen application rates on corn have remained virtually unchanged since 1989 -- although between 1993 and 1994, application rates increased by six pounds per acre. But in four major corn producing states, Ohio, Indiana, Missouri, and Michigan, nitrogen fertilizer application rates increased between 1989 and 1994.
In three of the top five corn producing states, Illinois, Indiana, and Nebraska, application rates exceed the national average by at least ten pounds per acre (Table 10). The experience of Iowa farmers, meanwhile, provides strong empirical evidence that corn producers in these states can significantly reduce their use of nitrogen fertilizer (Iowa State University 1993; Hallberg, et al. 1991; updated, 1995).
Table 10: Nitrogen fertilizer use on corn is heaviest in Illinois, Ohio, and Indiana
| State | Application Rate (Pounds/Acre) |
| Illinois | 153 |
| Ohio | 150 |
| Indiana | 148 |
| Missouri | 142 |
| Nebraska | 139 |
| Average | 129 |
| Iowa | 121 |
| Michigan | 116 |
| Minnesota | 108 |
| South Dakota | 90 |
| Wisconsin | 83 |
| National Average | 129 |
Source: USDA, 1995. Agricultural Chemical Usage: 1994 Field Crops Summary. National Agricultural Statistics Service. Washington, D.C..
In 1985, nitrogen fertilizer application rates in Iowa were 145 pounds per acre -- on par with those of farmers throughout the Corn Belt. However, between 1985 and 1994, average application rates in Iowa dropped by 16 percent, to 122 pounds of nitrogen fertilizer per acre. Meanwhile, fertilizer application rates for farmers in the remaining Corn Belt2 states remained at the same high rates.
In spite of significant statewide reduction in nitrogen fertilizer use, Iowa's corn yields remained higher than those of farmers throughout the Corn Belt (Figure 5). In an average year between 1989 and 1994, Iowa farmers used sixteen percent less fertilizer than farmers in other Corn Belt states -- and still achieved higher yields. In fact, Iowa farmers obtained record yields in 1992 and 1994, while dramatically decreasing fertilizer use (Hallberg, et al. 1991; updated 1995). As a result, Iowa farmers reduced their costs by 31-39 million dollars per year, and reduced the threat to water supplies considerably (Hallberg et al. 1991; Iowa State University 1993). Unfortunately, farmers in most other states have not followed Iowa's lead. For most farmers throughout the Corn Belt, fertilizer use can be dramatically and easily reduced.
Figure 5: Since 1985, Iowa farmers have dramatically decreased fertilizer use while continuing to obtain corn yields that exceed
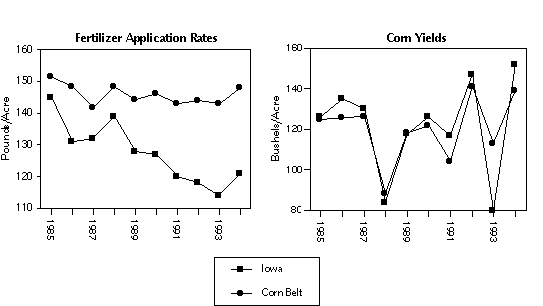
Fertilizer Use On Wheat
Wheat is an increasingly important source of nitrogen contamination in the environment. In 1994, more than three billion pounds of nitrogen fertilizer, thirteen percent of all applications, were applied to wheat. And in 1994, nitrogen fertilizer was applied to 87 percent of the nation's 53 million wheat acres, at an all-time high application rate of 68 pounds per acre (USDA 1995). These represent an increase of fourteen percent in the wheat acreage to which fertilizer was applied, and application rate increases of ten percent in the ten year period between 1984 and 1994.
Much like corn, wheat application rates vary dramatically from state to state. Illinois , Idaho, and Minnesota had the highest fertilizer application rates on wheat, and in six other states -- Texas, Missouri, Ohio, North Dakota, Washington, and Oklahoma -- wheat application rates were higher than the national average (Table 11). In Minnesota, application rates on wheat were nearly identical to application rates on corn.
Table 11: Nitrogen fertilizer use on wheat is highest in Illinois, Ohio, Indiana, and Missouri
| State | Application Rate (Pounds/Acre) |
| Illinois | 153 |
| Ohio | 150 |
| Indiana | 148 |
| Missouri | 142 |
| Nebraska | 139 |
| Average | 129 |
| Iowa | 121 |
| Michigan | 116 |
| Minnesota | 108 |
| South Dakota | 90 |
| Wisconsin | 83 |
| National Average | 129 |
Source: USDA, 1995. Agricultural Chemical Usage: 1994 Field Crops Summary. National Agricultural Statistics Service. Washington, D.C..
Fertilizer Use On Cotton
Approximately 1 billion pounds of nitrogen fertilizer are used on cotton in the United States each year, accounting for 4 percent of all annual use. Virtually all of this use occurs in six states: Arizona, California, Arkansas, Louisiana, Mississippi, and Texas. As it has on most other crops, nitrogen use on cotton has increased since 1985. Nationwide, 86 percent of the cotton crop receives nitrogen fertilizer, an increase of ten percent since 1985. The average application rate in 1994 was 110 pounds per acre, up 28 pounds per acre since 1987 -- a thirty-four percent increase in seven years. Again, in many states, cotton application rates are higher than the national average. In Arizona, application rates were 223 pounds per acre; in California, 188; and in Louisiana, 157. Because of its importance as a crop and the high nitrogen application rates, cotton often accounts for a major part of the nitrogen fertilizer used in agriculture areas like the South. For example, in Mississippi, 156 million pounds of nitrogen fertilizer were applied to 1.2 million acres of cotton -- accounting for 40 percent of the state's annual fertilizer use.
Fertilizer Use on Fruits, Vegetables, and other Crops
While the majority of the nation's fertilizer is used on high acreage crops such as corn, wheat, and cotton, there are numerous fruits and vegetables that may account for significant amounts of fertilizer use, particularly on a local basis. For most fruits and vegetables, nitrogen fertilizer application rates are higher -- often significantly higher -- than application rates on corn and wheat. In 1993, 8.8 billion pounds of nitrogen -- 39 percent of total national agricultural use -- were applied to fruits and vegetables and other "non-commodity" field crops (Vroomen and Taylor 1995). In Florida, Arizona, California, and Washington, these crops account for a major part of statewide fertilizer use, and can account for more nitrate contamination than fertilizer use on corn or wheat.
These crops are also major contributors to the recent increase in fertilizer use. Unlike corn, where application rates have either stabilized or increased only slightly over the past ten years, the use of nitrogen on the so-called "minor use" crops has increased dramatically. Between 1983 and 1993, the last year for which data are available, nitrogen applications on crops other than corn, wheat, or soybeans increased by over a third, over one million tons, from 3.2 million tons to 4.4 million tons.
Among field crops, fall potatoes account for a national use of 210 million pounds, with an average application rate of 195 pounds per acre -- a far higher rate than any other major crop. Rice -- primarily grown in Arizona and Louisiana -- accounts for 200 million pounds per year, with an average application rate of 115 pounds per acre. And although only 16 percent of all soybeans receive nitrogen fertilizer, a significant -- and growing -- amount of fertilizer is applied this crop. Since 1985, application rates have increased by 67 percent, from 15 to 25 pounds per acre, for a total of 144 million pounds per year (USDA 1995).
Many fruits and vegetables are also intensely fertilized (Table 12). Tomatoes, at 264 pounds per acre, and lettuce, at 262 pounds of nitrogen fertilizer per acre, are the two most intensively fertilized crops. Five other fruits or vegetables -- celery, bell peppers, cauliflower, lemons, and broccoli -- have nitrogen fertilizer application rates that exceed 200 pounds per acre, and 15 additional fruits and vegetables receive between 100 and 200 pounds of nitrogen fertilizer per acre.
Table 12: Nitrogen fertilizer is applied heavily to many fruits and vegetables
| Crop | Application Rate (Pounds/Acre) |
| Tomatoes, Fresh | 264 |
| Lettuce, Head | 262 |
| Celery | 240 |
| Peppers, Bell | 239 |
| Cauliflower | 230 |
| Lemons | 209 |
| Broccoli | 206 |
| Avocadoes | 198 |
| Tangerines | 197 |
| Oranges | 193 |
| Onions,Dry | 186 |
| Carrots | 182 |
| Cabbage | 167 |
| Grapefruit | 166 |
| Spinach | 149 |
| Apricots | 127 |
| Peaches | 121 |
| Watermelon | 120 |
| Nectarines | 118 |
| Plums | 113 |
| Cantaloupes | 104 |
| Asparagus | 100 |
| Pears | 97 |
| Prunes | 95 |
| Raspberries | 92 |
| Sweet Cherries | 90 |
| Beans, Snap | 85 |
| Honeydew Melons | 83 |
| Blueberries | 77 |
| Blackberries | 70 |
| Grapes | 61 |
| Apples | 56 |
Source: USDA, 1995. National Agricultural Statistics Service. Agricultural Chemical Usage: Vegetables, 1994 Summary; USDA 1994. National Agricultural Statistics Service. Agricultural Chemical Usage. Fruit 1993 Summary.
In some states, such as Arizona, Florida, and California, nitrogen fertilizer use on fruits and vegetables is even higher (Table 13). For example, Arizona watermelon growers have the nation's highest fertilizer application rate for any crop -- 414 pounds per acre. Lettuce growers in the state use 357 pounds per acre. In California, nitrogen fertilizer application rates on bell peppers are 320 pounds per acre, and application rates on celery are 317 pounds per acre. In Florida, tomatoes, the state's largest vegetable crop, receive an average nitrogen fertilizer application rate of 311 pounds per acre. In total, there are 45 different crop and state combinations where fertilizer application rates exceed 150 pounds per acre.
Table 13: Arizona's watermelon and lettuce growers use more nitrogen fertilizer per acre than producers of any other crop
| State | Crop | (Pounds/Acre) |
|---|---|---|
| Arizona | Watermelon | 414 |
| Arizona | Lettuce | 357 |
| California | Bell Peppers | 320 |
| California | Celery | 317 |
| Arizona | Cauliflower | 315 |
| Florida | Tomatoes | 311 |
| Georgia | Tomatoes | 286 |
| Florida | Bell Peppers | 284 |
| Arizona | Onions | 269 |
| Oregon | Onions | 268 |
| Florida | Cabbage | 258 |
| Arizona | Broccoli | 247 |
| California | Onions | 247 |
| California | Carrots | 234 |
| Texas | Cauliflower | 234 |
| Florida | Tangerines | 220 |
| California | Cauliflower | 219 |
| Wisconsin | Cabbage | 218 |
| Washington | Onions | 218 |
| California | Lettuce | 210 |
| Georgia | Cabbage | 207 |
| Arizona | Honeydew Melons | 206 |
| Georgia | Onions | 204 |
| Florida | Oranges | 204 |
| California | Broccoli | 203 |
| Washington | Carrots | 200 |
| California | Strawberries | 199 |
| Oregon | Broccoli | 193 |
| California | Tomatoes | 193 |
| Oregon | Cauliflower | 192 |
| NewJersey | Bell Peppers | 190 |
| NewYork | Tomatoes | 183 |
| California | Watermelon | 175 |
| Oregon | Blueberries | 174 |
| Arizona | Cantaloupes | 170 |
| New Jersey | Cabbage | 168 |
| Florida | Grapefruit | 168 |
| California | Cabbage | 162 |
| California | Spinach | 159 |
| California | Peaches | 156 |
| New Jersey | Spinach | 155 |
| North Carolina | Cabbage | 152 |
| New Jersey | Eggplant | 152 |
| Michigan | Celery | 151 |
| California | Grapefruit | 151 |
Source: USDA, 1995. National Agricultural Statistics Service. Agricultural Chemical Usage: Vegetables, 1994 Summary; USDA 1994. National Agricultural Statistics Service. Agricultural Chemical Usage. Fruit 1993 Summary.
Notes
1 This refers to the amount of nitrogen running off into surface waters draining the growing area (Smith and Alexander 1993).
2 Illinois, Indiana, Missouri, Ohio, and Nebraska.
Nitrogen Contamination of Drinking Water
Nitrate contamination of drinking water is a serious and growing problem that places thousands of infants at acute risk of contacting potentially deadly methemoglobinemia. Since 1986, over two million people drank water from municipal water systems that EPA found to be "significant non-compliers" with the federal drinking water standard for nitrate. Many of these water suppliers continued to supply unsafe water for years after problems were first discovered. An additional 3.8 million individuals who rely upon private wells contaminated with unsafe levels of nitrate for their tap water. Finally, tens of millions receive their water from water suppliers or wells that have nitrate contamination problems that are dangerously close to the current EPA standard, and already exceed guidelines established by international health authorities.
These contamination problems pose significant long and short-term risks, and are made even more critical by the fact that:
- The federal drinking water standard for nitrate contains no margin of safety to protect infants from acute, life-threatening methemoglobinemia, and does not adequately protect the population from potential risks of chronic health effects such as cancer and birth defects. The EPA nitrate standard is more than twice as weak as the same standard established by German and South African health authorities, and is much weaker than the same European Community guideline.
- The federal regulatory system does virtually nothing to prevent contamination of drinking water sources until it is too late -- when standards have already been violated and water consumers are placed at risk. This system virtually guarantees that once problems appear, they will continue to get worse. Current levels of nitrate contamination, even if they are not yet above EPA standards, are often precursors to full blown public health problems (Hallberg and Keeney 1993; Mueller, et al. 1995).
Our in depth study of nitrate contamination identifies four populations affected by varying degrees of nitrate contamination problems:
- Water systems that have been cited as significant non-compliers for violating the federal nitrate standard.
- Water systems that have some sources of drinking water contaminated at levels that exceed the federal standard, but have yet to be cited for violating the standard.
- Water systems suffering from systemic nitrate contamination that is extremely close to EPA standards and that typically exceeds international health guidelines for nitrate.
- Millions of families who rely on privately owned wells that are contaminated above federal standards.
First, we identified 2,016 water systems serving nearly 2.2 million people that were reported to EPA for violating the nitrate standard at least once between 1986 and 1995. All of these water systems were termed "significant non-compliers" by EPA (Table 14). In any given year, approximately 560 of these water systems will be cited for violating the nitrate standard.
Table 14: Over two million people drank water from systems that were significant non-compliers with the EPA nitrate standard.
| State | Number of Systems in Violation | Population Affected |
|---|---|---|
| Ohio | 36 | 413,441 |
| Arizona | 42 | 400,765 |
| California | 112 | 380,670 |
| Illinois | 156 | 274,332 |
| Pennsylvania | 456 | 154,877 |
| Kansas | 103 | 86,130 |
| Washington | 39 | 67,325 |
| Oklahoma | 132 | 66,938 |
| Iowa | 137 | 52,970 |
| Nebraska | 116 | 44,513 |
| Texas | 60 | 41,685 |
| Colorado | 22 | 39,707 |
| Connecticut | 8 | 21,142 |
| Delaware | 85 | 19,142 |
| Michigan | 74 | 18,435 |
| Maryland | 59 | 15,983 |
| New Jersey | 59 | 10,511 |
| New York | 16 | 10,323 |
| Wisconsin | 63 | 6,015 |
| Florida | 36 | 4,964 |
| Minnesota | 44 | 4,440 |
| Indiana | 35 | 3,798 |
| Kentucky | 5 | 3,428 |
| North Carolina | 19 | 2,720 |
| South Dakota | 13 | 2,619 |
| West Virginia | 6 | 2,303 |
| New Mexico | 12 | 1,938 |
| Virginia | 10 | 1,889 |
| Oregon | 8 | 1,820 |
| Vermont | 2 | 1,680 |
| Idaho | 4 | 1,530 |
| Rhode Island | 8 | 1,240 |
| Montana | 8 | 963 |
| Alaska | 7 | 850 |
| Missouri | 4 | 634 |
| South Carolina | 10 | 395 |
| Maine | 5 | 365 |
| Georgia | 1 | 200 |
| North Dakota | 3 | 155 |
| Massachusetts | 1 | 25 |
| Total | 2,016 | 2,162,860 |
Source: EPA. Safe Drinking Water Information System. 1996.
Table 15: Columbus, OH was the largest city affected by a violation of the nitrate standard between 1986 and 1995
| Time Spent in Violation of the Nitrate Standard | |||||||
|---|---|---|---|---|---|---|---|
| Rank | System | City | State | Population Served | Years | Most Recent Yr | |
| 1 | Columbus-Dublin Road Wtp | Columbus | OH | 269,400 | 5 | 1989* | |
| 2 | Scottsdale, Municipal Water | Scottsdale | AZ | 174,170 | 1 | 1988 | |
| 3 | Chandler Municipal Water Dept. | Chandler | AZ | 104,000 | 1 | 1993 | |
| 4 | Decatur | Decatur | IL | 83,885 | 8 | 1992 | |
| 5 | Upland, City Of | Upland | CA | 64,973 | 1 | 1987 | |
| 6 | Bloomington | Bloomington | IL | 54,566 | 8 | 1992 | |
| 7 | Peoria, City Of | Peoria | AZ | 50,618 | 1 | 1989 | |
| 8 | Manteca, City Of | Manteca | CA | 43,000 | 1 | 1987 | |
| 9 | West Bernardino CWD | Rialto | CA | 41,454 | 1 | 1987 | |
| 10 | Gilbert, Town Of | Gilbert | AZ | 40,000 | 1 | 1989 | |
| 11 | Interstate Water Company | Danville | IL | 38,000 | 7 | 1991 | |
| 12 | Jurupa CSD | Riverside | CA | 34,000 | 1 | 1986 | |
| 13 | Richland, City Of | Richland | WA | 32,600 | 1 | 1993 | |
| 14 | Bowling Green, City Of | Bowling Green | OH | 30,000 | 1 | 1986 | |
| 15 | Del Este WC - #4 Empire | Modesto | CA | 25,770 | 1 | 1988 | |
* The Columbus water system has exceeded the nitrate standard since 1989. However, under an agreement with the state they are allowed to exceed the standard as long as they notify water drinkers (Evans 1995).
Source: EPA. Safe Drinking Water Information System. 1996.
These "significant non-compliers" represent only a small facet of much more widespread nitrate contamination problems. Our original analysis of community-level drinking water monitoring data, using a database of over 150,000 testing results for nitrate obtained from state drinking water agencies, uncovered 1,077 water systems where at least one source of drinking water (usually a well, in some cases a river or reservoir) has exceeded the 10 ppm federal standard since 1993 (Table 16). These water suppliers served a population of over 12.4 million individuals.
Table 16: Over 1,000 water systems serving 12.4 million people have at least one water source polluted with nitrate at concentra
| State | Number of water systems with sources exceeding the federal nitrate standard | Population Affected |
|---|---|---|
| Arizona | 75 | 1,951,730 |
| California | 139 | 8,701,240 |
| Colorado | 32 | 83,849 |
| Delaware | 60 | 12,759 |
| Illinois | 27 | 18,797 |
| Iowa | 56 | 90,160 |
| Kansas | 67 | 93,049 |
| Maryland | 45 | 28,962 |
| Michigan | 6 | 3,442 |
| Minnesota | 15 | 27,098 |
| Montana | 5 | 270 |
| Nebraska | 118 | 107,027 |
| Ohio | 13 | 100,650 |
| Oregon | 24 | 6,642 |
| Pennsylvania | 112 | 220,796 |
| South Dakota | 8 | 1,914 |
| Tennessee | 2 | 760 |
| Texas | 114 | 734,478 |
| Washington | 126 | 104,329 |
| Wisconsin | 9 | 88,722 |
| Total | 1,053 | 12,376,674 |
Source: State drinking water agency nitrate monitoring database. Compiled by Environmental Working Group.
Table 17: Los Angeles, Santa Ana, and San Jacinto were the largest water systems in California to have one source of drinking wa
| Rank | System | City | Population Served | Date of most recent sample over federal nitrate standard | Percent of samples over federal nitrate standard | Number of samples taken | Maximum test result |
|---|---|---|---|---|---|---|---|
| 1 | Los Angeles | Los Angeles | 3,600,000 | 6/15/95 | 1.1% | 190 | 12.5 |
| 2 | City Of Santa Ana | Santa Ana | 293,700 | 11/22/95 | 24.0% | 146 | 12.9 |
| 3 | Eastern MWD | San Jacinto | 253,705 | 5/9/95 | 3.7% | 54 | 12.2 |
| 4 | City Of Riverside | Riverside | 245,000 | 11/30/95 | 6.6% | 457 | 35.6 |
| 5 | Glendale-City, Water Dept. | Glendale | 184,000 | 11/7/95 | 5.4% | 331 | 11.9 |
| 6 | California Water Service | Bakersfield | 182,670 | 7/13/95 | 3.6% | 357 | 13.1 |
| 7 | City Of Modesto | Modesto | 180,320 | 10/7/94 | 7.7% | 260 | 13.9 |
| 8 | City Of Pasadena | Pasadena | 153,217 | 6/23/93 | 8.3% | 24 | 12.8 |
| 9 | San Gabriel Valley Water Co. | El Monte | 150,105 | 3/13/95 | 3.2% | 317 | 12.3 |
| 10 | City Of Garden Grove | Garden Grove | 148,000 | 1/12/93 | 1.3% | 77 | 14.5 |
| 11 | City Of Ontario | Ontario | 143,285 | 1/25/94 | 1.1% | 179 | 10.2 |
| 12 | Pomona- City, Water Dept. | Pomona | 136,525 | 12/4/95 | 38.0% | 739 | 22.5 |
| 13 | Cucamonga CWD | Rancho Cucamonga | 128,000 | 11/22/95 | 11.3% | 160 | 15.5 |
| 14 | Desert Water Agency | Palm Springs | 125,000 | 1/27/93 | 1.6% | 61 | 11.8 |
| 15 | City Of Corona | Corona | 104,000 | 8/9/95 | 50.0% | 44 | 26.7 |
| 16 | San Gabriel Valley WC | Fontana | 102,599 | 11/7/95 | 9.2% | 295 | 18.3 |
| 17 | California Water Service | Salinas | 100,300 | 9/8/94 | 5.3% | 114 | 13.3 |
| 18 | Suburban Water Systems | San Jose | 93,758 | 11/15/95 | 17.9% | 563 | 30.9 |
| 19 | Daly City MWU | Daly City | 92,311 | 10/19/95 | 50.0% | 18 | 15.1 |
| 20 | City Of Alhambra | Alhambra | 86,300 | 6/8/94 | 5.7% | 35 | 12.7 |
| 21 | California Water Service | Visalia | 82,300 | 4/8/93 | 0.5% | 182 | 10.0 |
| 22 | Cal-Water Service Co. | Chico | 73,220 | 12/15/94 | 2.3% | 177 | 13.6 |
| 23 | Palmdale WD | Palmdale | 70,000 | 2/2/95 | 4.9% | 41 | 12.3 |
| 24 | Redlands City MUD | Redlands | 69,300 | 5/16/95 | 4.0% | 430 | 36.0 |
| 25 | City Of Upland | Upland | 66,383 | 5/31/94 | 1.7% | 59 | 17.5 |
| 26 | Casitas Municipal WD | Oakview | 60,000 | 2/21/95 | 50.0% | 2 | 12.0 |
| 27 | California Water Service | South San Francisco | 56,200 | 12/29/94 | 40.0% | 25 | 18.4 |
| 28 | East Valley WD | San Bernardino | 55,000 | 10/12/95 | 6.3% | 573 | 16.7 |
| 29 | Calif Water Service | Los Altos | 53,740 | 3/21/94 | 1.3% | 80 | 10.0 |
| 30 | City Of Chino | Chino | 52,130 | 10/26/95 | 35.3% | 85 | 19.2 |
| 31 | City Of Tustin | Tustin | 52,100 | 1/26/95 | 31.6% | 38 | 15.9 |
| 32 | California Water Service | Livermore | 50,670 | 10/6/94 | 22.2% | 27 | 15.8 |
| 33 | Cal. American Water Co. | San Marino | 49,353 | 5/22/95 | 10.5% | 105 | 15.2 |
| 34 | Azusa Valley WC | Azusa | 49,000 | 6/2/94 | 1.1% | 179 | 10.6 |
| 35 | City Of Arcadia | Arcadia | 48,290 | 10/10/95 | 3.6% | 448 | 28.0 |
| 36 | Valencia WC | Valencia | 48,000 | 10/19/94 | 1.8% | 55 | 10.4 |
| 37 | City Of Turlock | Turlock | 48,000 | 3/16/94 | 1.8% | 56 | 10.9 |
| 38 | Glendora-City, Water Dept. | Glendora | 48,000 | 11/21/95 | 28.1% | 488 | 15.5 |
| 39 | San Gabriel CWD | San Gabriel | 45,000 | 11/28/95 | 28.4% | 148 | 14.2 |
| 40 | Lake Hemet MWD | Hemet | 43,939 | 11/15/95 | 12.5% | 24 | 14.2 |
| 41 | City Of Covina | Covina | 43,800 | 8/15/95 | 100.0% | 12 | 24.9 |
| 42 | South California WC | San Dimas | 43,056 | 11/22/95 | 70.2% | 161 | 17.5 |
| 43 | City Of San Luis Obispo | San Luis Obispo | 42,500 | 1/27/93 | 1.5% | 67 | 12.0 |
| 44 | Tulare, City Of | Tulare | 39,800 | 7/21/95 | 3.4% | 59 | 10.7 |
| 45 | Monte Vista CWD | Montclair | 38,000 | 11/1/95 | 32.6% | 141 | 30.9 |
| 46 | City Of Monrovia | Monrovia | 37,545 | 1/5/95 | 4.8% | 227 | 15.9 |
| 47 | Calif Cities Water | Orcutt | 33,218 | 7/3/95 | 3.9% | 76 | 11.1 |
| 48 | City Of Azusa | Azusa | 33,066 | 2/25/93 | 4.2% | 24 | 23.4 |
| 49 | Indian Wells Valley CWD | Ridgecrest | 32,630 | 2/2/94 | 2.8% | 36 | 11.0 |
| 50 | South California WC | Claremont | 32,543 | 5/10/95 | 20.9% | 86 | 24.6 |
Source: State drinking water agency nitrate monitoring database. Compiled by Environmental Working Group.
Table 18: Phoenix, El Paso, and Mesa, AZ were the largest water systems with one source of drinking water with concentrations ab
| Rank | System | City | State | Population Served | Date of most recent sample of federal nitrate standard | Percent of samples over federal nitrate standard | Number of Samples Taken | Maximum Test Result |
|---|---|---|---|---|---|---|---|---|
| 1 | Phoenix Munic. Water System | Phoenix | AZ | 1,000,000 | 10/26/94 | 7.3% | 82 | 17.4 |
| 2 | El Paso Water Utilities | El Paso | TX | 620,000 | 5/26/93 | 2.0% | 49 | 13.5 |
| 3 | Mesa, Munic. Water Dept. | Mesa | AZ | 302,000 | 8/10/94 | 2.4% | 41 | 11.0 |
| 4 | Scottsdale | Scottsdale | AZ | 174,170 | 10/20/94 | 1.0% | 105 | 10.0 |
| 5 | Glendale Munic. Water CC | Glendale | AZ | 150,000 | 3/1/95 | 10.5% | 57 | 16.0 |
| 6 | Chandler, Munic. Wtr Dept. | Chandler | AZ | 120,000 | 10/12/94 | 5.0% | 60 | 13.9 |
| 7 | Janesville Water Utility | Janesville | WI | 52,133 | 12/5/94 | 100.0% | 1 | 11.0 |
| 8 | Peoria, City Of | Peoria | AZ | 50,618 | 10/6/94 | 13.3% | 15 | 12.6 |
| 9 | State College Boro. Water Auth. | State College | PA | 47,000 | 2/18/93 | 3.2% | 31 | 10.4 |
| 10 | Newark, City Of | Newark | OH | 46,000 | 11/10/94 | 2.8% | 36 | 41.0 |
| 11 | Gilbert, Town Of | Gilbert | AZ | 45,000 | 6/24/94 | 7.1% | 14 | 19.4 |
| 12 | Utility Parkway | Cedar Falls | IA | 34,298 | 4/10/95 | 1.4% | 71 | 10.6 |
| 13 | Richland, City Of | Richland | WA | 32,600 | 6/27/95 | 19.3% | 942 | 19.0 |
| 14 | Friendswood, City Of | Friendswood | TX | 27,108 | 6/12/95 | 5.0% | 20 | 30.1 |
| 15 | AZ Water Co., Casa Grande | Casa Grande | AZ | 26,121 | 1/11/94 | 8.3% | 24 | 12.1 |
| 16 | Pasco Water Department | Pasco | WA | 25,465 | 8/30/94 | 33.3% | 36 | 17.4 |
| 17 | Citizens Util., Mohave | Bullhead City | AZ | 25,000 | 6/13/95 | 31.3% | 16 | 15.0 |
| 18 | SACWSD - Shallow Well #18 | Commerce City | CO | 22,400 | 6/7/95 | 8.5% | 59 | 12.3 |
| 19 | Avondale, City Public Works | Avondale | AZ | 22,000 | 6/16/93 | 22.2% | 9 | 14.0 |
| 20 | Kearney, City Of | Kearney | NE | 21,751 | 7/14/93 | 25.0% | 8 | 16.4 |
| 21 | Dodge City, City Of | Dodge City | KS | 21,294 | 2/8/95 | 17.8% | 45 | 16.2 |
| 22 | Bonney Lake Water Department | Bonney Lake | WA | 18,586 | 5/10/94 | 14.3% | 14 | 27.0 |
| 23 | Great Bend PWS/Central KS Utils | Great Bend | KS | 15,427 | 3/1/95 | 7.1% | 28 | 10.4 |
| 24 | Spanaway Water Company | Spanaway | WA | 14,613 | 9/22/94 | 7.7% | 26 | 27.0 |
| 25 | Brighton, City Of | Brighton | CO | 14,500 | 5/25/93 | 15.4% | 26 | 18.5 |
| 26 | Ephrata Joint Authority | Ephrata | PA | 14,300 | 7/14/93 | 2.9% | 35 | 11.0 |
| 27 | Shippensburg Boro. Water | Shippensburg | PA | 13,500 | 5/20/94 | 5.3% | 19 | 10.2 |
| 28 | Horsham Water Authority | Horsham | PA | 13,304 | 1/26/93 | 2.3% | 44 | 101.7 |
| 29 | Beatrice, City Of | Beatrice | NE | 12,891 | 7/14/94 | 36.4% | 22 | 252.9 |
| 30 | Sterling, City Of | Sterling | CO | 12,500 | 7/11/94 | 23.5% | 34 | 13.1 |
| 31 | Dover Township Water | Dover | PA | 12,050 | 7/6/95 | 11.8% | 51 | 17.0 |
| 32 | Vernon, City Of | Vernon | TX | 12,001 | 6/13/95 | 91.7% | 24 | 16.0 |
| 33 | Fitchburg Utility District 1 | Fitchburg | WI | 11,890 | 5/24/94 | 100.0% | 1 | 11.1 |
| 34 | Lamesa, City Of | Lamesa | TX | 11,838 | 6/12/95 | 33.3% | 3 | 10.5 |
| 35 | Valley View Mobile Home Park | Manchester | OH | 11,500 | 5/20/94 | 18.5% | 27 | 11.8 |
| 36 | Urbana,City Of | Manchester | OH | 11,500 | 5/24/95 | 28.1% | 57 | 12.9 |
| 37 | Trenton, City Of | Manchester | OH | 11,500 | 6/15/94 | 5.3% | 19 | 10.2 |
| 38 | New Waterford, Village of | Manchester | OH | 11,500 | 10/11/94 | 9.1% | 11 | 18.0 |
| 39 | Oconomowoc Waterworks | Oconomowoc | WI | 10,993 | 1/24/94 | 100.0% | 1 | 11.7 |
| 40 | Burkburnett, City Of | Burkburnett | TX | 10,668 | 3/7/95 | 75.0% | 12 | 18.4 |
| 41 | Shakopee | Shakopee | MN | 10,300 | 2/21/95 | 25.9% | 27 | 12.0 |
| 42 | Tri County Joint Mun. Auth. | Fredericktown | PA | 10,000 | 2/3/93 | 14.3% | 7 | 12.9 |
| 43 | Kutztown Borough | Kutztown | PA | 9,100 | 4/25/94 | 8.3% | 24 | 10.1 |
| 44 | Ft. Morgan, City Of | Fort Morgan | CO | 9,000 | 8/1/95 | 6.3% | 32 | 11.0 |
| 45 | USAF-Davis Monthan AFB | Tucson | AZ | 8,900 | 5/17/94 | 2.3% | 44 | 96.0 |
| 46 | Mccook, City Of | Mccook | NE | 8,404 | 11/10/93 | 23.8% | 21 | 16.4 |
| 47 | Gering, City Of | Gering | NE | 7,760 | 12/20/93 | 20.0% | 25 | 12.5 |
| 48 | Coatesville, City of Authority | Coatesville | PA | 7,500 | 1/13/95 | 15.4% | 13 | 10.0 |
| 49 | Plover Waterworks | Plover | WI | 6,850 | 3/24/94 | 100.0% | 1 | 13.4 |
| 50 | Catasauqua Mun. Water Works | Catasauqua | PA | 6,700 | 10/12/94 | 7.7% | 13 | 11.6 |
Source: State drinking water agency nitrate monitoring database. Compiled by Environmental Working Group.
Three quarters of these water suppliers with demonstrated contamination above federal standards have not been cited as significant non-compliers for violating the federal nitrate standard. There are a number of reasons for this.
- Many water suppliers simply fail to adequately monitor their water for nitrate contamination. According to data obtained from the EPA's Safe Drinking Water Information System, in 1993-1994 over 11.6 million people drank water from nearly 10,000 water systems that violated a federal nitrate monitoring requirement.
- Many state regulatory agencies have been lax in reporting violations to the federal EPA. Audits by the EPA, the General Accounting Office, and private organizations have indicated that states frequently fail to report any violation of drinking water standards to EPA (GAO 1990; NRDC 1994).
- Many surface water supplied systems, particularly in Ohio and Illinois, are essentially sanctioned by the state to provide water that does not meet current standards. Some of these communities have been frequent violators of the nitrate standard in past years. Rather than solving the problem, these water systems are allowed to serve unsafe water to their communities with the stipulation that the public is warned when their water is unsafe for infants to drink. As long as these systems inform the community that the water is unsafe for pregnant women and infants, they are not reported in violation of the nitrate standard, though the levels of nitrate in the water may exceed 10 ppm. In spite of these warnings, infants in these communities remain at significant risk because of prolonged exposures (during heavy runoff periods) to nitrate at concentrations that are extremely close to or above the 10 ppm federal standard.
- Where water suppliers are dependent upon groundwater, systems are often able to avoid serving water with illegal levels of nitrate in spite of contamination of individual wells that exceeds federal standards. This is accomplished by mixing contaminated water with clean water, or closing contaminated wells. Unfortunately, the costs of these band-aid solutions is high: thousands of water suppliers have had to close contaminated wells, dig new wells, or make other expensive adjustments in water service to lower nitrate levels in tap water. These expenses cost the polluters nothing. They often, however, impose significant costs on water customers. And of course, if contamination continues, eventually some of these systems will no longer have adequate supplies of uncontaminated water.
Some international health authorities have recognized the health risks for infants of exposure to nitrate below the current EPA standard of 10 ppm. The European Community has established a health guideline for nitrate of 5.6 ppm; in Germany and South Africa, the enforceable standard is set at 4.4 ppm. In the United States, the state of Illinois requires community-wide warnings when nitrate levels exceed 8.5 ppm. These indications of concern from health authorities underscore the risks to the millions of individuals in the third group of communities we identify, over 5,600 water systems serving 35 million people where the drinking water is contaminated with nitrate above natural background levels, that is often extremely close to EPA standards and that typically exceed international health guidelines (Table 19).
Table 19: Millions drink water that exceeds international health guidelines for nitrate
| Systems with a sample over 3 ppm | Systems with a sample over the international health guideline | |||||
|---|---|---|---|---|---|---|
| State | Systems | Population | Systems | Population | ||
| Arizona | 306 | 2,920,707 | 172 | 2,741,447 | ||
| California | 550 | 17,017,216 | 322 | 14,022,314 | ||
| Colorado | 121 | 500,303 | 75 | 456,388 | ||
| Delaware | 221 | 367,782 | 150 | 252,521 | ||
| Illinois | 174 | 1,294,347 | 97 | 744,778 | ||
| Iowa | 206 | 906,576 | 137 | 724,617 | ||
| Kansas | 315 | 430,221 | 185 | 291,552 | ||
| Maryland | 312 | 591,451 | 176 | 193,339 | ||
| Michigan | 31 | 51,194 | 16 | 14,135 | ||
| Minnesota | 79 | 185,502 | 39 | 113,754 | ||
| Montana | 43 | 20,177 | 22 | 17,374 | ||
| Nebraska | 465 | 376,389 | 317 | 291,992 | ||
| Ohio | 112 | 564,826 | 43 | 229,782 | ||
| Oregon | 245 | 218,315 | 111 | 133,209 | ||
| Pennsylvania | 739 | 5,432,162 | 392 | 2,077,889 | ||
| South Dakota | 65 | 30,491 | 22 | 11,508 | ||
| Tennessee | 85 | 99,043 | 16 | 27,223 | ||
| Texas | 494 | 1,267,739 | 261 | 875,133 | ||
| Washington | 879 | 1,264,087 | 372 | 524,825 | ||
| Wisconsin | 121 | 1,281,902 | 52 | 303,611 | ||
| Total | 5,563 | 34,820,430 | 2,977 | 24,047,391 | ||
Source: State drinking water agency nitrate monitoring database. Compiled by Environmental Working Group.
In many cases, nitrate contamination of these water systems is still at relatively low levels. Unfortunately, in many others it is already exceeding international guidelines, or approaching the EPA's 10 ppm standard. We identified twenty-four million individuals in nearly 3,000 communities where tap water or wells contain nitrate at concentrations that exceed the European health guideline. And we identified 313 additional water systems serving 2.8 million people with "water to watch" -- where at least one sample was above 9 parts per million (Table 20).
Table 20: Water to Watch: Hundreds of water systems have water supplies contaminated with nitrate at concentrations approaching
| Rank | System | City | State | Population Served | Highest Sample | Date of Highest Sample | Number of Samples Taken | % over Int'l Standard |
|---|---|---|---|---|---|---|---|---|
| 1 | Waterloo Water Works | Waterloo | IA | 66,467 | 9.9 | 8/10/94 | 113 | 25.7% |
| 2 | East Hempfield Water Authority | Landisville | PA | 13,493 | 9.9 | 9/15/93 | 73 | 58.9% |
| 3 | Harford County Dpw | Bel Air | MD | 63,000 | 9.9 | 7/26/93 | 20 | 10.0% |
| 4 | Westminster | Westminster | MD | 22,766 | 9.9 | 2/18/93 | 18 | 77.8% |
| 5 | City Of Wasco | Wasco | CA | 13,774 | 9.8 | 2/14/95 | 7 | 42.9% |
| 6 | Northern Il Wtr Corp-Pontiac | Pontiac | IL | 11,200 | 9.8 | 3/26/95 | 63 | 50.8% |
| 7 | City Of Lancaster Authority | Lancaster | PA | 108,000 | 9.8 | 2/8/94 | 18 | 38.9% |
| 8 | Cal. Water Service Co.-East L.A. | San Jose | CA | 152,970 | 9.8 | 7/13/93 | 21 | 23.8% |
| 9 | Morro Bay City Water Dept | Morro Bay | CA | 15,000 | 9.8 | 7/5/95 | 25 | 28.0% |
| 10 | City Of Manteca | Manteca | CA | 44,500 | 9.8 | 3/5/93 | 24 | 41.7% |
| 11 | City Of Chino Hills | Chino Hills | CA | 49,000 | 9.8 | 11/10/93 | 17 | 35.3% |
| 12 | Chippewa Falls Waterworks | Chippewa Falls | WI | 12,989 | 9.7 | 8/30/93 | 1 | 100.0% |
| 13 | Hillcrest Wc - 1,2,3 & 4 | Yuba City | CA | 10,062 | 9.6 | 7/25/95 | 6 | 33.3% |
| 14 | City Of Fresno | Fresno | CA | 390,350 | 9.6 | 8/31/94 | 312 | 17.6% |
| 15 | Garden City, City Of | Garden City | KS | 24,097 | 9.5 | 5/9/94 | 27 | 22.2% |
| 16 | Ottumwa Water Works | Ottumwa | IA | 24,488 | 9.5 | 5/1/95 | 14 | 50.0% |
| 17 | Lca-Wlsa Central Division | Wescosville | PA | 17,285 | 9.4 | 6/21/94 | 244 | 95.9% |
| 18 | Bucks Co Water And Sewer Auth | Warrington | PA | 16,200 | 9.4 | 12/26/93 | 3 | 33.3% |
| 19 | La Crosse Waterworks | La Crosse | WI | 51,000 | 9.4 | 12/15/93 | 1 | 100.0% |
| 20 | Decatur | Decatur | IL | 83,885 | 9.4 | 6/6/95 | 134 | 43.3% |
| 21 | Cuc - Suburban | Sacramento | CA | 32,000 | 9.3 | 2/16/95 | 69 | 14.5% |
| 22 | City Of Davis | Davis | CA | 48,250 | 9.3 | 7/26/95 | 116 | 13.8% |
| 23 | City Of Bakersfield | Bakersfield | CA | 57,740 | 9.3 | 10/3/94 | 62 | 8.1% |
| 24 | West San Bernardino Cwd | Rialto | CA | 41,454 | 9.3 | 3/6/95 | 34 | 50.0% |
| 25 | Bloomington | Bloomington | IL | 52,000 | 9.3 | 5/30/95 | 63 | 41.3% |
| 26 | City Of Downey | Downey | CA | 91,000 | 9.2 | 2/17/93 | 53 | 3.8% |
| 27 | Northampton Bucks Co. Mun Auth | Richboro | PA | 30,000 | 9.2 | 9/8/94 | 40 | 2.5% |
| 28 | Metropolitan Water Co | Tucson | AZ | 36,250 | 9.2 | 12/23/93 | 109 | 6.4% |
| 29 | City Of Rialto | Rialto | CA | 48,418 | 9.1 | 12/7/93 | 131 | 27.5% |
| 30 | Oxnard Wd | Oxnard | CA | 146,571 | 9.1 | 6/22/95 | 23 | 17.4% |
| 31 | Del Este | Modesto | CA | 11,851 | 9.1 | 5/12/93 | 8 | 37.5% |
| 32 | Chester Water Authority | Chester | PA | 110,000 | 9.1 | 1/21/94 | 11 | 45.5% |
| 33 | City Of Anaheim | Anaheim | CA | 286,680 | 9.0 | 8/9/95 | 136 | 22.8% |
| 34 | University of Pennsylvania | University Park | PA | 37,000 | 8.9 | 7/13/94 | 45 | 37.8% |
| 35 | Il American Wtr Cmpny-Pekin | Pekin | IL | 39,000 | 8.9 | 7/19/94 | 34 | 11.8% |
| 36 | San Jose Water Company | San Jose | CA | 921,000 | 8.9 | 5/17/93 | 264 | 11.4% |
| 37 | City Of Ceres | Ceres | CA | 28,988 | 8.9 | 2/2/95 | 8 | 50.0% |
| 38 | City Of Delano | Delano | CA | 29,944 | 8.9 | 8/10/93 | 47 | 53.2% |
| 39 | Us Army Fort Irwin | Fort Irwin | CA | 16,000 | 8.8 | 2/14/95 | 42 | 26.2% |
| 40 | Security W&SD | Colorado Springs | CO | 10,007 | 8.8 | 4/3/95 | 80 | 93.8% |
Source: State drinking water agency nitrate monitoring database. Compiled by Environmental Working Group.
Because the current regulatory system allows nitrate contamination to continue until it has exceeded the 10 ppm standard many of these systems will likely face substantial health risks and costs to fix future problems. In the interim, pollution of these aquifers or other sources of drinking water is allowed to continue, and sensitive populations are put at increased risk of immediate and long-term health problems due to nitrate contamination.
Finally, we also identify 3.8 million people drinking water from private wells that are contaminated with nitrate above the 10 ppm health standard (Table 21). Contamination of these wells is important and unique because they are not regulated. As a consequence, health authorities in most states cannot ensure that families with contaminated wells and small children avoid drinking the water.
Table 21: 3.8 million individuals drink water from domestic wells that exceed federal nitrate standards
| State | Population Above EPA Stds. | % Contaminated Above EPA Stds. |
|---|---|---|
| Delaware | 48,311 | 35.0% |
| Kansas | 69,944 | 28.0% |
| Iowa | 124,771 | 18.3% |
| California | 428,301 | 15.0% |
| New York | 239,685 | 15.0% |
| Nebraska | 52,870 | 14.0% |
| Arizona | 37,612 | 14.0% |
| Illinois | 164,510 | 12.0% |
| Colorado | 29,800 | 12.0% |
| Wisconsin | 148,582 | 10.0% |
| Texas | 80,404 | 9.4% |
| Minnesota | 134,365 | 9.3% |
| Pennsylvania | 245,241 | 9.0% |
| Connecticut | 55,412 | 9.0% |
| Maryland | 67,437 | 8.0% |
| Maine | 43,100 | 8.0% |
| New Jersey | 61,936 | 6.8% |
| South Dakota | 9,428 | 6.7% |
| Virginia | 96,205 | 6.4% |
| Wyoming | 6,899 | 6.4% |
| Missouri | 51,330 | 5.0% |
| Oregon | 27,477 | 5.0% |
| North Dakota | 7,170 | 4.6% |
| Indiana | 69,900 | 4.5% |
| Kentucky | 42,289 | 4.2% |
| Idaho | 9,536 | 4.0% |
| Nevada | 3,215 | 4.0% |
| Arkansas | 22,341 | 3.9% |
| Ohio | 66,474 | 3.8% |
| Montana | 7,342 | 3.8% |
| North Carolina | 59,926 | 3.2% |
| Alaska | 4,763 | 3.2% |
| New Mexico | 6,165 | 2.0% |
| Utah | 1,140 | 2.0% |
| Washington | 13,533 | 1.5% |
| New Hampshire | 5,809 | 1.4% |
| Vermont | 3,213 | 1.4% |
| Michigan | 20,234 | 1.2% |
| Oklahoma | 5,762 | 1.2% |
| Florida | 17,099 | 1.0% |
| Georgia | 13,141 | 1.0% |
| Massachusetts | 5,118 | 1.0% |
| Tennessee | 8,175 | 0.9% |
| West Virginia | 5,396 | 0.9% |
| Louisiana | 4,855 | 0.8% |
| South Carolina | 9,579 | 0.7% |
| Mississippi | 1,316 | 0.2% |
Source: Compiled by Environmental Working Group from state and federal monitoring data.
Public Water Systems
Millions Drink Water that Exceeds EPA Nitrate Standards
According to data reported to the EPA's Safe Drinking Water Information System (SDWIS), 2,016 water systems serving over two million people have been cited for violating EPA's nitrate standard in the ten year period between 1986 and 1995 (Table 14). In EPA parlance, these water systems immediately become "significant non-compliers" by virtue of exceeding the nitrate standard. Because the EPA nitrate standard contains no safety factor, each violation presents a significant, immediate risk of acute methemoglobinemia to infants in those communities.
Between 1986 and 1995, violations of the nitrate standard were reported in 40 of the 50 states. Much of the affected population, however, is concentrated in Ohio, where 413,441 people drank from these most contaminated systems, Arizona, with 400,765 people affected, and California, with 380,670 people served water from systems that violated the nitrate standard. In two other states, Illinois and Pennsylvania, more than 100,000 people drank water from water suppliers cited as significant violators of the nitrate standard (Table 14).
Nitrate Contamination Affects Communities Large and Small
The ten largest communities reporting violations of EPA's nitrate standard since 1985 were Columbus, OH; Scottsdale, AZ; Decatur, IL; Upland, CA; Bloomington, IL; Peoria, IL; Manteca, CA; Gilbert, AZ; West Bernadino, CA; and Danville, IL (Table 15). The vast majority of water systems with EPA certified nitrate violations, however, were small or medium sized, serving populations of less than 10,000 people. Of the 2,016 water systems reporting a violation in the eleven year period, 36 served populations of greater than 10,000 (accounting for a total of 1.46 million people), 37 served populations between 3,330 and 10,000 (accounting for a total of 205,000 people), and 1,943 water systems, 96 percent of those affected, served populations of less than 3,300 people (accounting for a total of 495,000 people).
The severity of the nitrate problem is a particular concern in small communities because they are the least well equipped to solve drinking water problems. Due to the small populations they serve, it is difficult and expensive for these communities to remedy a nitrate contamination problem, either by digging new wells or by installing new treatment techniques. To make matters worse, amendments to the Safe Drinking Water Act (S. 1316) that passed the Senate in November 1995, would allow small systems variances from some contamination standards as long as the ensuing solution is "adequate to protect the public health". This loophole -- which makes a weak section of current law even weaker -- is tailor-made to avoid real solutions to nitrate contamination problems. Under this amendment it is certain that more small systems will deal with nitrate in drinking water at levels over 10 ppm through warnings, attempting to provide expensive bottled water, or other band-aid type strategies that place the onus on the drinkers, place more infants at risk, and do not in any way reduce nitrate contamination problems.
Many Water Systems Suffer From Repeated or Unsolved Problems
EPA data also indicate that when nitrate problems are found, they often remain unsolved. In an average year between 1985 and 1994, 568 water systems, serving a population of 650,000 people officially violated the nitrate standard. Of the 2,016 public water systems that reported a violation, nearly 60 percent -- 1,190 -- were repeat violators of the nitrate standard during the years between 1986 and 1995. And more than 625 water systems serving a total population of almost 773,000 people, experienced violations of the nitrate standard in at least four calendar years between 1986 and 1995. Ten water systems reported a violation of the nitrate standard in every year between 1986 and 1995. And seven large systems -- Pontiac, Streator, Decatur, Bloomington, and Danville, IL, as well as Burkburnett, Texas and Morgan Hill, California -- all reported violations of the nitrate standard in at least six of the ten calendar years.
These repeat incidents indicate that many water systems are simply unable to guarantee safe water for their community. Because the nitrate problem is caused by upstream pollution that local authorities have been powerless to stop, problems continue to go unsolved. Faced with the choice of either installing new, expensive treatment systems, or serving unsafe tap water with warnings, the response of many water systems has been simply to warn the community and hope that the problem will go away on its own, despite clear evidence that it will not. And many state governments, including some of the hardest-hit states like Ohio and Illinois, simply go along with these band-aid solutions, doing little to require farmers and other polluters to modify their activities, or to force water suppliers to build new treatment systems.
The Problem Is Getting Worse and Is Linked To High Fertilizer Use
EPA's Safe Drinking Water Information Systems (SDWIS) data indicate that the problem is getting worse. In 1993-94, the most recent two-year period for which complete data are available, 890 water suppliers, serving 734,000 people, violated the nitrate standard. This was a 25% increase in the number of violators in the previous two-year period (1991-92), and the highest two year total in the ten years for which data are available.
There is also a clear relationship between states and regions with high fertilizer use and nitrate contamination violations. Of the ten states with the most number of people affected by nitrate problems, six -- California, Ohio, Illinois, Kansas, Iowa, and Nebraska -- were also among the ten states with the highest annual fertilizer usage. The other four, Arizona, Pennsylvania, Washington, and Oklahoma, all have heavy regional use of fertilizer or manure within the state.
Over 10 Million People Drink Water from Systems with Wells Contaminated by Nitrate at Levels Over Federal Health Standards
Nitrate monitoring data obtained from 21 state drinking water agencies shows that in addition to the hundreds of public water supplies that are reported to EPA for violating a nitrate standard each year, thousands of these systems must contend with supply wells that are contaminated, often above the current standard. The majority of these systems have not been reported to EPA by their state governments for violating the nitrate standard. This does not mean, however, that there are no problems with the community water supply.
Many public water suppliers rely on more than one raw water source. They may draw water from a number of different wells, or from a local river in addition to wells. Our review of over 150,000 monitoring records provided by 21 state drinking water agencies, shows that more than 12.4 million people were served by over 1,000 water suppliers who reported at least one well or tap water sample containing nitrate above the current EPA standards of 10 ppm (Table 16).
California has the nation's most extensive nitrate contamination problems. Since 1993, 139 of the states public water suppliers had at least one sample from a major well or tap water source that contained nitrate at a concentration that exceeded the current EPA standard ((Table 16) and (Table 17)). Together, these water systems served 8.7 million of the state's 30 million citizens. In five other states, Kansas, Nebraska Delaware, Iowa, and Colorado, more than five percent of the state's water suppliers for which we had data had at least one sample of nitrate above EPA standards. Arizona reported 75 systems serving almost two million people with one major source of drinking water over the 10 ppm standard at some point in the past three years. Texas is third with 734,000 people drinking from 114 water systems with at least one tap water sample or major source of drinking water over the 10 ppm standard at some point in the past three years, followed by Pennsylvania with 220,000, Nebraska with 107,000, Washington with 104,000, and Ohio with 100,000. And the Ohio total does not include the cities of Columbus, Alliance, Tiffin and several others that are essentially allowed to provide drinking water contaminated with nitrate at over 10 ppm based on agreements with the state that require public notification. In all of these states, nitrogen fertilizer use is high, and accounts for the majority of nitrogen contamination.
Some of the largest cities with at least one well that is contaminated above EPA standards include Los Angeles, Phoenix, and Mesa, Arizona, as well as Santa Ana, San Jacinto, and Riverside, California ((Table 17) and (Table 18)). In some cases, large communities have reported contamination in wells that exceeds the federal standard by wide margins. The highest nitrate sample reported in a large water system (defined as a water system serving more than 10,000 people) was 253 ppm, in Beatrice, Nebraska.
To their credit, water suppliers with nitrate contamination problems frequently solve problems before they are officially considered to be in violation of EPA standards. In many cases, however, individuals in these communities were served water that contained unsafe concentrations of nitrate even as water suppliers took aggressive measures to ensure that citizens in these communities could drink water that met EPA standards. Unfortunately, these solutions often require difficult and expensive efforts by water providers to deliver safe water to their communities. Generally, water suppliers must either dig new, deeper wells, install new water treatment techniques, or, more frequently, mix water from contaminated wells with water from uncontaminated wells to ensure that nitrate concentrations remain below a level of concern. Polluters of course, pay none of these costs -- they are all passed on to those who are forced to drink the polluted water. And in many cases, vulnerable infants may drink water in violation of health standards as the problem is being fixed.
Future Problems With Contaminated Water Systems
Our analysis of communities with contaminated wells points to even greater long-term problems1 -- communities where drinking water is polluted with nitrate at concentrations that are approaching EPA standards, and that frequently have already exceeded international health guidelines. Because the current regulatory system allows nitrate contamination to continue until it is too late -- when it has exceeded the 10 ppm standard and water drinkers are saddled with unsafe water and the bill to fix the problem -- many of these systems will likely face problems in the future. In the interim, pollution of these aquifers or other sources of drinking water is allowed to continue, and sensitive populations are put at increased risk of short and long-term health problems due to nitrate contamination. In just the twenty-one states for which data was available, we identified more than 24 million people, served by nearly 3,000 water systems that reported at least one well or tap water sample containing nitrate above international health guidelines (5.6 ppm, the guideline established by the European Community) (Table 19), and nearly 35 million people, served by 5,563 water systems that reported at least one well or tap water sample that is contaminated with nitrate from man-made sources2.
In California, 20 percent of the water suppliers for which data are available have at least one well or water source with nitrate contamination that exceeds the European health guideline of 5.6 ppm (Table 19). The Corn Belt, the region of highest fertilizer use, is also hard hit. In Kansas and Nebraska, 30 percent or more of the states' water systems have nitrate contamination that exceeds 5 ppm. In Pennsylvania, 19% of the states water systems have one source of water contaminate by nitrate above 5 ppm; and in Maryland and Delaware, 18% and 26% of the states' water systems exceed the international health guideline.
This nitrate contamination, particularly when it approaches EPA standards, poses important health risks, particularly to sensitive members of the population. The scientific literature reports that numerous cases of methemoglobinemia have been reported at concentrations below EPA's current 10 ppm standard (Sattelmacher 1964; Simon 1962). Nitrate exposure below EPA standards has also been linked to increased risk of cancer and other chronic effects (see previous chapter for detail discussion). And because nitrogen-based fertilizers continue to be used in record amounts, many of these contamination problems will continue to get worse until they have exceeded EPA standards.
Many of the larger water systems that have nitrate contamination problems rely upon polluted rivers for their drinking water. Some of these water suppliers (such as Decatur, IL and Columbus, OH) have been frequent violators of the nitrate standard in past years, or have come quite close (in communities such as Lancaster, PA and Ottumwa, IA). Rather than solve the problem, most of these water systems are simply relying upon the hope that nitrate contamination in the river will not exceed standards again. Unfortunately, infants in these communities remain at significant risk because of prolonged exposures (during heavy runoff periods) to nitrate at concentrations that are extremely close to the 10 ppm standard.
Hundreds of communities have "water to watch" -- meaning that, although they have not yet exceeded the nitrate standard in any well or water source, they have come extraordinarily close. A total of 313 water systems serving 2.8 million people in the 21 states have had at least one nitrate sample between nine and ten parts per million. Four large water systems reported samples of 9.9 ppm nitrate - extremely close to violating the nitrate standard. (Table 20). Other large water systems that have come close to exceeding the standard include Lancaster, Pennsylvania (with one sample at 9.8 ppm), Fresno (9.6 ppm), and LaCrosse, Wisconsin (9.4 ppm).
All of the water systems that have water to watch, whether they rely upon surface or ground water, are clearly high-risk communities. Infants in these communities may be at greater risk than infants in communities that violate the standard because in nearly all of these cases, no warnings will be made, nor any efforts required to reduce these nitrate levels, which some health authorities consider to be unsafe for infants (see discussion of German and South African health standards and European health guidelines, chapter 1)
The Costs of Nitrate Contamination
The costs of nitrate contamination of drinking water can be seen in many ways. Unfortunately, it is consumers, not polluters, who pay the bill when water suppliers are forced to dig new wells or install new treatment technologies to reduce nitrate contamination. For example, after years of persistent nitrate problems and water alerts caused by upstream farmers use of fertilizer, the Des Moines, Iowa Water Works was forced to install a new $4 million water treatment system. Unfortunately, Des Moines citizens had to pay for this new system, although fertilizer use by upstream farmers caused the problem (Huber 1992).
Similarly, residents of Bowling Green, Ohio were faced with increased costs and more pesticides in their water due to efforts that the utility was forced to undertake because of upstream farmers overruse of fertilizer. Bowling Green gets its water from the Maumee River, which is heavily polluted by nitrate and agricultural weed killers. The utility was forced to build a vast holding tank so that they could selectively draw water from the river on days when nitrate concentrations were low to avoid exceeding the nitrate standard. Unfortunately, later studies found that this holding tank had the effect of increasing the concentrations of weed killers that were in city tap water supplies (Cohen, et al. 1995). Because of upstream nitrate pollution, Bowling Green residents were forced to pay for "improvements" to their water system -- which ultimately increased their exposure to other chemical contaminants.
In other cases, communities were forced to close wells, develop capacity to blend contaminated water with less contaminated water, or dig new wells. Personal communication with water suppliers indicates that in many cases, the cost of digging new wells arranging blending plans, or closing contaminated wells runs in the range of $200,000-$500,000 per well. Nationwide, thousands of wells have been shut down because of nitrate contamination problems.
In 1988, in what was clearly an underestimate of the total cost of nitrate contamination in the state (because many water systems fixed problems without having to apply for state aid), a report to the California State Legislature concluded that water systems in California had requested over $48 million in state aid in that year alone (equivalent to over $65 million in 1995 dollars) for remedial measures to solve nitrate contamination problems (Anton, et al. 1988).
Using extremely conservative estimates, assuming that California accounts for one third of the nation's nitrate problems, the 1988 estimates would mean that nationwide, water suppliers are spending approximately $200 million per year to solve nitrate problems. And on top of this, there are an estimated 3.8 million individuals with domestic wells that exceed the nitrate standard. These individuals must either dig new wells or buy bottled water -- which can cost hundreds of dollars per year -- in order to ensure the safety of their infants. Finally, farmers themselves pay for their high use of nitrate. If the nations' farmers could match their Iowa brethren and reduce fertilizer use by approximately 20%, they would save an estimated $750 million per year on fertilizer use. These conservative estimates make it abundantly clear: overuse of fertilizer, and the attendant drinking water problems have cost water drinkers and fertilizer users billions of dollars in the last decade.
Domestic Drinking Water Wells
Approximately 45 million people nationwide receive their tap water from private wells rather than municipal water systems. A number of factors make these domestic wells particularly susceptible to contamination. As a general rule, private wells are shallower than most municipal supply wells. While municipal wells are routinely drilled to a depth of one hundred feet or more, it is not uncommon to find individual wells that are less than 20, or even less than 10 feet deep. In addition, many of these wells are located on farms, or in rural areas where nitrogen fertilizer use is high. This is especially troubling because private wells are typically beyond the purview of federal, state, and even local health standards, leaving public health authorities unable to ensure adequate protection from nitrate contamination for the children and families using these wells.
3.8 Million Drink From Private Wells Contaminated Over the 10 PPM Nitrate Standard
A series of state and national studies have shown that a large population is placed at risk due to contamination on individual water supply wells. The most recent and comprehensive national-scale study of nitrate in domestic water supply wells was conducted by the United States Geological Survey (USGS) as part of their National Water Quality Assessment Program (NAWQA) (Mueller, et al. 1995). This study consisted of over 12,000 ground water samples from a variety of different land use settings (agricultural, urban, forest, and rangeland) and well types and depths, including domestic and public supply wells. Nine percent of all domestic water supply wells tested -- wells which provide drinking water for approximately 3.8 million people -- were contaminated with nitrate above the EPA's Maximum Contaminant Level.
The results further showed that a significant number of wells were contaminated, although not yet above EPA standards. Thirty-one percent of all domestic wells -- providing water for a population of over 13 million people, contained some evidence of nitrate contamination from human sources (above 3 ppm), and one in five domestic wells contained nitrate concentrations that exceeded five parts per million.
Agricultural Regions Are Hardest Hit
Agricultural regions of the country -- where nitrogen fertilizer use is highest -- have the worst nitrate contamination problems (Mueller, et al. 1995). The USGS study analyzed wells in four separate land-use regions -- agricultural, range, forest, and urban -- and found the highest levels of contamination in agricultural regions. In agricultural regions, 21.2 percent of all wells tested exceeded the drinking water nitrate MCL -- a contamination rate that was significantly higher than the rate for wells found in forest (3.0%), range (8.5%), or urban (7.0%) areas. The median nitrate concentration in agricultural wells was 3.4 parts per million -- again, far higher than the median concentration for wells found in forest (0.1 ppm), range (1.5 ppm) or urban (1.8 ppm) wells. The authors of the study concluded that,
"Elevated nitrate concentrations in areas of more homogeneous cropland probably were a result of intensive nitrogen fertilizer application on large tracts of land" (Mueller, et al. 1995 p. 1).
Nitrate Contamination of Ground Water Is Increasing
Contamination problems are increasing with time. Many researchers have concluded that the full effect of overapplication of nitrate fertilizer will not be felt for 30 to 40 years (Hallberg and Keeney 1993), meaning that for most wells that are already contaminated, problems will only become worse.
In one of the nation's most thoroughly studied areas, the Big Spring Basin in Iowa, nitrogen fertilizer use increased approximately three-fold between 1960 and 1990, and the increase in nitrate in ground water "directly paralleled these increases" (Hallberg and Keeney 1993).
The recent USGS report documented a number of other cases where nitrate contamination had increased over time. Six wells in an agricultural region in the Southeast and four from agricultural regions in the Snake River Basin were analyzed over a period of ten to twenty years, and in every case these wells showed statistically significant increases in nitrate concentration (Mueller, et al. 1995).
And, over a ten year study of the Platte River valley in Nebraska, as heavy fertilizer use continued, nitrate concentrations increased throughout the underlying aquifer (Spalding and Exner 1990).
As long as widespread overapplication of nitrogen fertilizer continues, contamination of groundwater will continue to get worse. If a community or an individual has a contaminated well due to overapplication of fertilizer, action must begin immediately to solve the problem. Farmers must begin using less fertilizer, and using it more efficiently today in order to prevent additional problems tomorrow.
State Level Analyses - Data Sources
To complement the recent USGS NAWQA studies, as well as other national and regional scale studies, and to better quantify the number of people drinking from contaminated private wells on a state by state basis, we analyzed a number of additional data sources.
For fourteen states -- Arkansas, Illinois, Iowa, Indiana, Kansas, Louisiana, New Jersey, North Carolina, Ohio, Oregon, Texas, Virginia West Virginia, and Wisconsin -- we used data from state level sources (generally, in-state university researchers) to estimate the number of individuals exposed to nitrate at concentrations greater than 10 ppm.
For other states, we relied upon the most recent USGS NAWQA studies. If adequate data were available -- more than 100 samples -- we based our estimates only on samples collected from domestic supply wells. This was the case in nine states, California, Florida, Georgia, Maryland, Missouri, Nebraska, Nevada, Pennsylvania, and Washington. In other cases, there was insufficient data from water supply wells, and we based estimates on USGS samples of all wells. This was the case in nine additional states, Colorado, Connecticut, Delaware, Georgia, Idaho, Maine, Massachusetts, New Mexico, New York, and Oregon. In all states, the number of individuals drinking ground water from privately owned wells was obtained from U.S. Geological Survey water-use data (Perlman 1994).
In the majority of states, the percentage of domestic wells that were contaminated above the federal standard was higher than the percentage of all wells (including domestic drinking water wells, industrial wells, irrigation wells, observation wells, etc.) that were contaminated above the standard. Nationally the USGS found that seven percent of all wells, but nine percent of domestic wells were contaminated at greater than 10 ppm nitrate. This means that, in cases where we looked at data from all wells instead of just domestic supply wells, our results most likely underestimated the affected population.
These 32 states account for the majority of the nations well water drinkers, as well as accounting for most the regions of intense agriculture. For the remaining states where recent state or USGS data was not available, we relied upon older compilations of USGS data, collected from 1960-1985. Again, these compilations most likely underestimate the current extent of contamination. On a national basis, the older USGS studies estimated that 6.4 percent of all sampled wells contained nitrate above the EPA MCL. More recent USGS studies indicate that nine percent of domestic wells are contaminated above the EPA standard.
State Level Results
The states with the highest percentages of domestic wells contaminated above federal standards are Delaware, Kansas, Iowa, California, and New York (Table 21). A total of ten states, Nebraska, Arizona, Illinois, Colorado, and Wisconsin, in addition to the previous five -- have over 10 percent of the wells in their state contaminated above the federal standards. In twelve more states more than five percent of domestic wells are contaminated by nitrate at concentrations that exceed federal safety standards.
In seventeen states, more than 50,000 people were exposed to unsafe concentrations of nitrate in domestic wells, and in seven states -- California, Pennsylvania, New York, Illinois, Wisconsin, Minnesota, and Iowa -- more than 100,000 people were exposed to unsafe levels (Table 21). In these states, thousands, of infants are at acute risk of contacting potentially fatal methemoglobinemia from their tap water.
Not surprisingly, virtually all of the states with high percentages of contaminated wells or large exposed populations also have high statewide or regional use of fertilizer or nitrate. Six of the ten states with the highest percentages of wells above the standard -- Kansas, Iowa, California, Nebraska, Texas, and Minnesota -- also were among the ten states with the highest application of fertilizers in 1994. And the percentage of wells that are contaminated in the ten highest fertilizer use states is also significantly higher than the percentage in the remaining states. In the 1995 study of over 12,000 wells conducted by the United States Geological Survey (Mueller, et al. 1995), nine percent of all wells sampled in the top ten fertilizer using states were found to be contaminated above the current EPA standard. In contrast, thirty-three percent less -- six percent of all tested wells -- were contaminated in the forty states with lower fertilizer use. And as previously noted, this same study found that 21 percent of domestic water wells in agricultural regions were contaminated at levels above the nitrate standard, a rate far higher than in urban, forest, or rangeland areas.
Notes
1. Throughout the remainder of this section, when referring to contaminated water supplies, we are referring to those with nitrate concentrations detected above 3 parts per million (ppm). As discussed previously, nitrate is a naturally occurring compound, and it can frequently be detected in groundwater at low concentrations. However, it is generally accepted that concentrations detected above 3 ppm are an indication of contamination from anthropogenic sources -- either fertilizer, manure, or some other point source of contamination.
2. Nitrate was detected at a concentration of greater than 3 ppm in these wells. This represents the generally accepted cutoff point between naturally occurring nitrate and nitrate contamination due to human sources.
Solving the Nitrate Problem
Use nitrogen, but use it wisely. This is the resounding refrain from researchers around the world. Since 1980, hundreds of published, peer reviewed papers, based upon the experiences of thousands of farmers, have shown that farmers can substantially reduce nitrogen fertilizer use, and better manage manure -- without reducing crop yield, and often while increasing profits. So why don't farmers just do it? Because nitrogen fertilizer is relatively low cost crop insurance that, up to a point boosts yields, and because farmers pay none of the costs to remedy the environmental and public health damage that they cause by excess and poorly managed nitrogen fertilizer and manure applications.
The most authoritative review of the issue was completed in 1993 by the Board on Agriculture of the National Research Council of the National Academy of Sciences. The committee concluded that each year in American agriculture there are six to nine million metric tons more nitrogen in farm fields than can be used by the crops growing in those fields. In other words, one fifth to one third of the nitrogen in the environment is unneeded. If farmers converted freely available nitrogen into reductions in fertilizer use, they would reduce contamination of water supplies and save an estimated two to three billion dollars annually1.
In the carefully understated words of the NAS committee,
"The magnitude of estimated positive (nitrogen) balances does help to explain the prevalence of elevated nitrate concentrations in surface water and groundwater in intensive agricultural watersheds" (NRC 1993 pg. 262).
This committee's consensus recommendations for "reducing the mass of residual nitrogen in the soil-crop system..." were:
- Accounting for all sources of nitrogen in the system,
- Refining estimates of crop nitrogen requirements,
- Refining yield goals,
- Synchronizing the application of nitrogen with crop needs, and
- Increasing the seasonal nitrogen uptake in the cropping system.
Accounting for All Sources of Nitrogen
On a regional and farm level, farmers are ignoring major sources of nitrogen and overapplying billions of pounds of fertilizers each year. According to the National Academy of Sciences, "the nitrogen applied to corn in synthetic fertilizer exceeded that removed in the grain (corn) by 50 percent or more every year since 1968" (NRC 1993 p. 60). These calculations did not include additional nitrogen available to crops in these field from legumes and manure.
Overall, in all crops, nitrogen application including fertilizer use, manure, and plant residue, exceeds crop needs by approximately 33 percent, or eight billion pounds of excess nitrogen per year (NRC 1993). In the words of the Academy committee, "The single most important way to improve nitrogen management is to reduce supplemental applications of nitrogen to account for nitrogen supplied by legumes and manure" (NRC 1993 p. 67).
Animal manure is the most often overlooked source of nitrogen for crops. Many growers apply manure to their fields, and nationally, economically recoverable nitrogen from animal manure accounts for approximately eight to nine percent of total nitrogen inputs, and even higher in some regions of the country. Surveys indicate, however, that many farmers do not adequately account for the nitrogen in the manure they apply to their fields (Duffy and Thompson 1991). As a result, they then overapply nitrogen fertilizer.
Another substantial source of nitrogen is that made available from nitrogen-fixing crops such as alfalfa or beans. When these crops are grown, they leave available nitrogen in the soil, and when the next crop is planted, farmers do not need to apply as much fertilizer. As with manure, however, most producers do not fully account for this crop-supplied nitrogen. A 1990 study concluded that 56 percent of fields where corn was grown following alfalfa had more than twice as much nitrogen as necessary for economically optimal yields; 86 percent had more than the optimal amount of nitrogen (El Hout and Blackmer 1990).
These, and numerous other analyses show that there is ample room for growers to improve nutrient management by accurately accounting for all nitrogen inputs. In the Corn Belt, alfalfa is grown on approximately 8 percent of cropland and contributes approximately 1.1 million tons of nitrogen annually (NRC 1993). If farm practices accounted for the nitrogen available from alfalfa and manure, fertilizer-N applications in the Corn Belt could be reduced by eight to fourteen percent (Peterson and Russelle 1991). This would reduce nitrogen fertilizer applications by nearly one billion pounds per year, reduce the risk to water supplies, and save the region's farmers approximately $150 million annually in production costs. In some states with greater alfalfa production, fertilizer could be reduced even more than the regional average. For example, by simply accounting for nitrogen from alfalfa, fertilizer applications could be reduced by 20-36 percent in Michigan, and by up to a whopping 66 percent in Wisconsin (Peterson and Russelle 1991). And these conservative estimates do not include inputs from soybeans and all sources of manure.
Nitrogen balances indicate that similar reductions can be achieved easily in other regions of the country. In the southeast, regional scale studies taking precipitation, fertilizer application, and input from legumes into account indicated that 47-75 percent of total nitrogen used was unaccounted for (Lowrance et al 1985, in NRC 1993).
Realistic Yield Goals
Only a minute percentage of farmers apply nitrogen to their crops based on a thorough assessment of availability, timing, needs, and profitability of nitrogen fertilizer in a given field. Reducing nitrogen pollution in the environment will require that farmers develop and implement thorough nitrogen management plans.
Realistic yield goals are an essential component of these plans. Currently a major percentage of crop yield goals in American agriculture are inflated beyond reason by a variety of factors including commodity program subsidies, the unrealistic expectation that the goal each year should be to achieve the absolute peak yield ever achieved in a given field, and the fact that farmers pay none of the cost of pollution caused by excessive fertilizer applications used to attain maximum yields. Yield goals should be rational, and based on the likelihood of maximum profitability. Currently the majority of them are not (NRC 1993).
Proper Timing of Nitrogen Application
Properly timing nitrogen application can substantially reduce nitrogen losses to ground and surface water. For the most efficient use, nitrogen fertilizer must be applied after the seedlings emerge from the soil -- at the time when crops are using the most nitrogen.
Pre-plant or pre-emergence (fall or spring) applications lead to substantial nitrogen losses because of the lag between application and use by the crop (Pereira and Dos Santos 1991; Peterson and Frye 1989). Nonetheless, large statistically stratified surveys conducted by the USDA's Economic Research Service show that many corn growers continue to use vast amounts of nitrogen fertilizer in the fall or spring, in spite of the fact that much of this nitrogen can be washed out of the root zone long before it reaches the crops for which it was intended (USDA 1992). In 1992, 55 percent of over 5,000 corn growers surveyed applied nitrogen fertilizer in the fall or spring. Forty percent apply fertilizer in the spring, eighteen percent in the fall (four percent applied fertilizer in both the fall and the spring).
Not surprisingly, growers who apply fertilizer in the fall or spring also use more fertilizer than those who do not. For growers not applying fertilizer in the fall or spring, the average nitrogen application rate was only 95 pounds per acre. For those applying in either the fall or spring, the average application rate was 134 pounds of nitrogen per acre. And for those applying fertilizer in both the fall and the spring, the average application rate was the highest of all, 149 pounds of nitrogen per acre.
Nitrogen Soil Tests
A vital tool to improve the timing and reduce the amount of nitrogen fertilizer applied are soil tests that can estimate how much nitrogen is available and needed in the soil at any given time. Among the most refined of these tests is the Pre-Sidedress Nitrogen Test (PSNT) for corn, which measures the amount of nitrogen available to plants in the top foot of soil in the late spring, when corn is 6 to 12 inches high. These tests are designed to help farmers sample early enough to apply additional nitrogen if it is needed but late enough to account for spring weather conditions. Armed with this knowledge, producers can fully account for all available nitrogen in their fields, and apply the amount of fertilizer necessary to obtain the optimal yields.
In Iowa, statewide surveys between 1987 and 1991 using the PSNT indicated that in 50% of corn fields, soil nitrate concentrations before the addition of fertilizer were equal to or greater than the critical concentration needed for optimal yields (Frable, et al. 1994). Nationally, farmers who use the soil test have reduced their nitrogen fertilizer application rates on corn by an average of 26 percent (Woodward, et al. 1995)
In Iowa, the nation's top corn producing state, three different studies under actual field conditions support the applicability of the PSNT (Frable, et al. 1994). All three found virtually no difference in yields between tested and non-tested fields, with yield changes that were non-existent or insignificant -- one to two percent at most. Growers using the test, meanwhile, reduced application rates by 36 percent, from 131 to 84 pounds per acre. And because they maintained yields while reducing their nitrogen use, farmers using the PSNT increased profits by $2.00-$16.00 per acre (Frable, et al. 1994). In the largest test, conducted by 70 farmers participating in an Iowa Natural Heritage Resourceful Farming demonstration project, fertilizer use was reduced by 46 percent, with less than a one percent decrease in yields. As a result, the producers who use the test obtained an average increase in profits of $5.75 per acre, with profits increasing for some farmers by as much as $46.00 per acre.
And these nitrogen soil tests are inexpensive. A 1994 USDA survey found that in virtually all cases soil nitrogen tests, which are often performed by state agricultural agencies, cost less than $10.00. In four states -- Maryland, Virginia, Connecticut, and Delaware -- the tests were free. In major midwestern farming states such as Ohio, Iowa, Wisconsin, Minnesota, and Michigan, the test cost less than $10.00. Indiana, where nitrogen soil testing costs $20.00, was the most expensive state for soil testing. Particularly when the savings due to using less nitrogen are taken into account, there are no financial burdens to growers using nitrogen tests before applying fertilizers.
Most Producers Are Not Using Nitrogen Tests
Although the soil tests have been very effective in helping farmers reduce nitrogen application rates and increase profits, use of the test is not widespread. Even in the Chesapeake Bay states of Pennsylvania and Maryland, where the nitrogen test was offered for free as part of Nutrient Management Programs, they are not widely used. In states where adequate data is available, no more than 16% of all corn acreage was tested for nitrogen content. In no state were more than 100,000 corn acres tested using the PSNT (Woodward, et. 1995). In large corn producing states like Iowa and Michigan, less than 25,000 acres were tested using the pre-sidedress nitrogen test. Clearly, increased use of the PSNT would go a long way to help farmers reduce nitrogen applications.
Farmers Can and Have Reduced Nitrogen Fertilizer Application Rates - The Iowa Example
No state is more evocative of the Corn Belt than Iowa, and in no state have farmers done more to try to reduce their overreliance on nitrogen fertilizer. In the mid-1980s, the state's scientists and policymakers began to understand the true scope of their nitrate contamination problem, and the need for solutions. The end result was an aggressive education effort by the State Extension Service to inform farmers how they could reduce their fertilizer use. The prescriptions were not new, but they have rarely been so vigorously pursued. They included the establishment of realistic yield goals, improving the rate and timing of applications, full crediting for manure and nitrogen fixing crops, and the use of soil samples to test for nitrogen content (Hallberg, et al. 1991, Iowa State University 1993).
The plan worked. In 1985, nitrogen fertilizer application rates in Iowa were 145 pounds per acre -- on par with those of farmers throughout the Corn Belt. Between 1985 and 1994, average application rates in Iowa dropped by 16 percent, to 122 pounds of nitrogen fertilizer per acre. Meanwhile, fertilizer application rates for farmers in the other Corn Belt states2 increased or remained at the same high rates. Iowa's corn yields remained consistent with those of farmers throughout the Corn Belt (Figure 6). In fact, Iowa farmers obtained record corn yields in 1992 and 1994.
In an average year between 1989 and 1994, Iowa farmers used sixteen percent less fertilizer than farmers in other Corn Belt states and still achieved higher yields (Hallberg 1991; updated 1995). As a result, Iowa farmers reduced their costs by 31-39 million dollars per year, and reduced the threat to water supplies considerably (Hallberg, et al. 1991, Iowa State University 1993). Most states have not initiated such an aggressive nitrogen reduction program, although Nebraska and Wisconsin have worked to reduce nitrate contamination of groundwater in certain vulnerable areas.
On most farms throughout the Corn Belt, and on many farms throughout the country, nitrogen is overapplied based on estimates that do not account for all sources of available nitrogen, and failure to time and measure applications for optimal profitability. Until nitrogen fertilizer is used more prudently, through the widespread adoption of well known and accepted nitrogen management practices, nitrate contamination of groundwater and surface water will continue, and the cost to fix the resulting drinking water and other water quality problems will rise.
Notes
1. Based on an estimated cost of $0.15 per pound of nitrogen applied as fertilizer (University of Iowa 1993)
2. Illinois, Indiana, Missouri, Ohio, and Nebraska.